


Join the 1000’s of founders, investors, crypto funds, brokerage firms, and developers in getting free cutting edge crypto research by subscribing below:
Waiting For U-Turns
The crypto markets closed 2.2% down last week in a broad red week for risk assets.
Last Thursday (US CPI print) was the most volatile, where crypto saw an intraday move of 7% falling closer to its channel bottom of $820B.
The hotter-than-expected headline CPI number of 8.2% YoY sent risk assets like equities tumbling to only then recovery shortly afterwards. Short covering that necessitated the purchase of equities was likely a key driver for the swift rebound and crypto seemed to have benefited from this dynamic too.

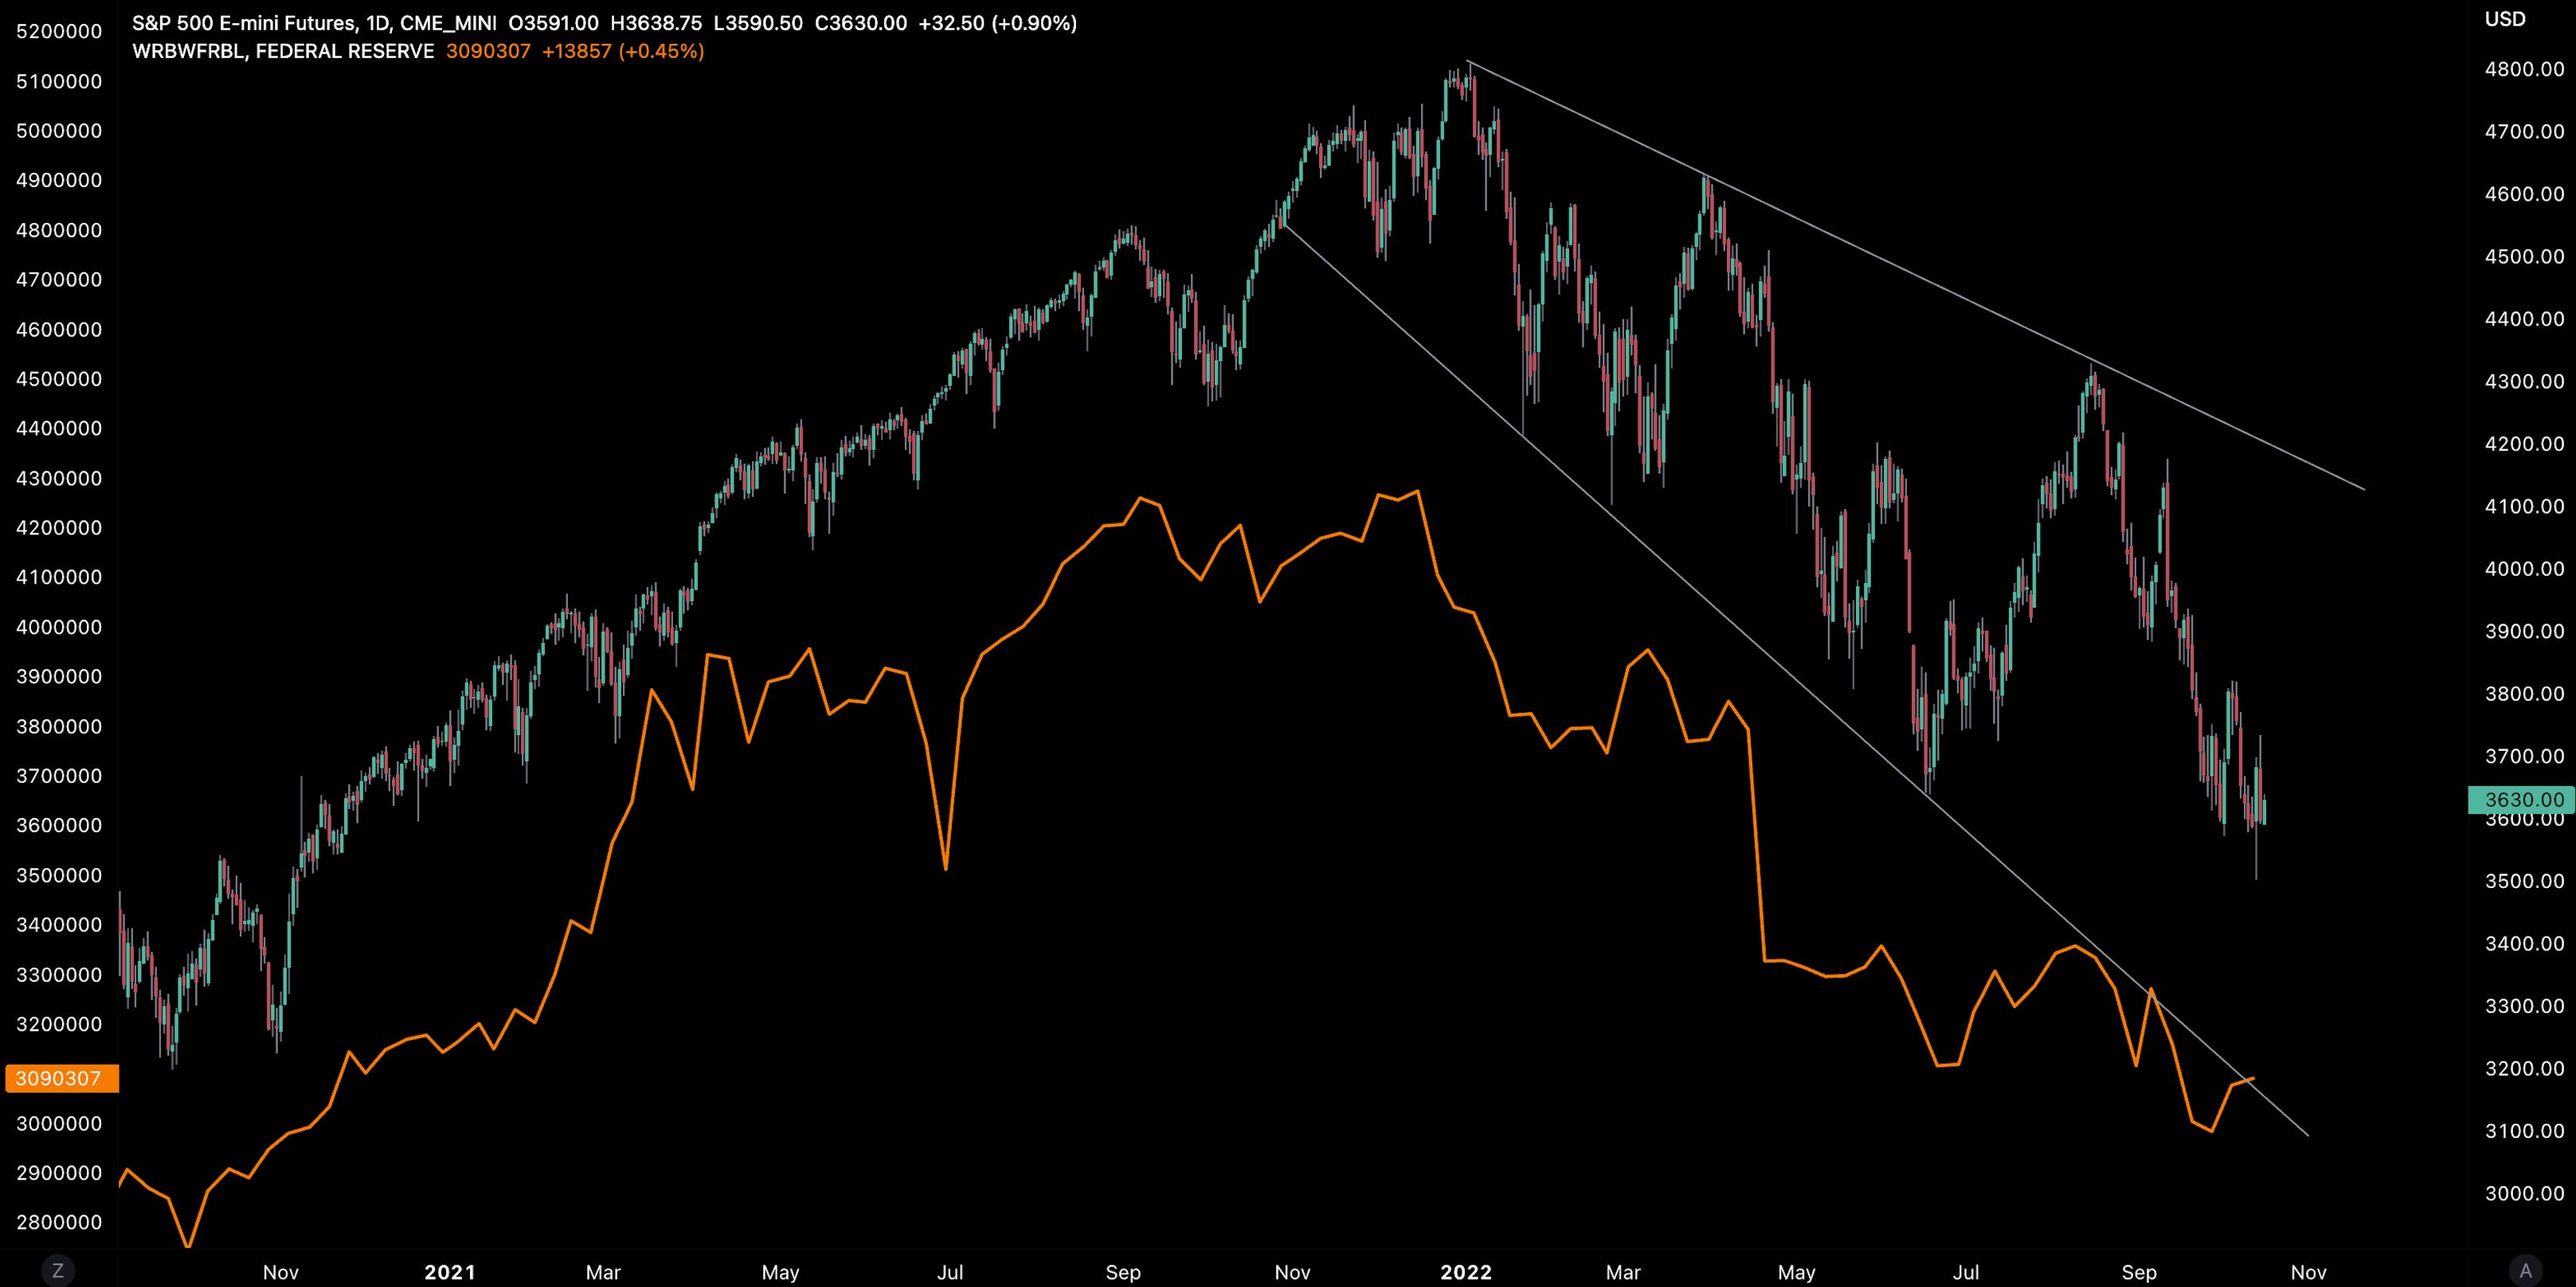
Fast forward to today and contracts for SPX and NDX have risen after tumbling intensely on Friday.
The more bleak outlook for consumer prices in the US has lead an increasing number of bets of jumbo rate hikes by the Fed. This is while liquidity gets drained everywhere including the US bond market.
Coupled with dire earnings, the tune remains the same - bearish risk assets with bear future market rallies between 15-25% sprinkled throughout.
What investors are now paying attention to is bond market dysfunction. Implied volatility as measured by ICE BofA MOVE Index is at all-time-highs since 2009.
The key point here is that lower demand at US debt auction means governments are needing to pay more to borrow.
The UK seems to reversing its mistakes, making U-turns on fiscal policies that have rattled markets for the past month.
The consensus view is the Fed will continue to raise rates until ‘something breaks’ and it seems like the most likely area will be the bond market. Just how far the Fed will tread the current path is not clear.

The latest Bloomberg MLIV Pulse survey suggests that investors expect the US (via stocks and bonds) will lead the way out of the current wave of market turmoil - and they are probably right.
The implication here being the Fed remains the north star for many asset allocators and right now the Fed seems committed to raise rates between 4.5%-5%.
Perhaps the most important signal here is US markets maybe the first to recover with stocks be favoured over bonds. For crypto, it begs the question whether the high risk tech market may in turn lead US equities. This seems plausible.
However, the path to cooling the labor market sufficiently and bringing inflation closer to the 2% target is a long one. ‘Peak hawkishness’ is nowhere to be seen just yet.

Divergent Crypto
So where is crypto in all of this?
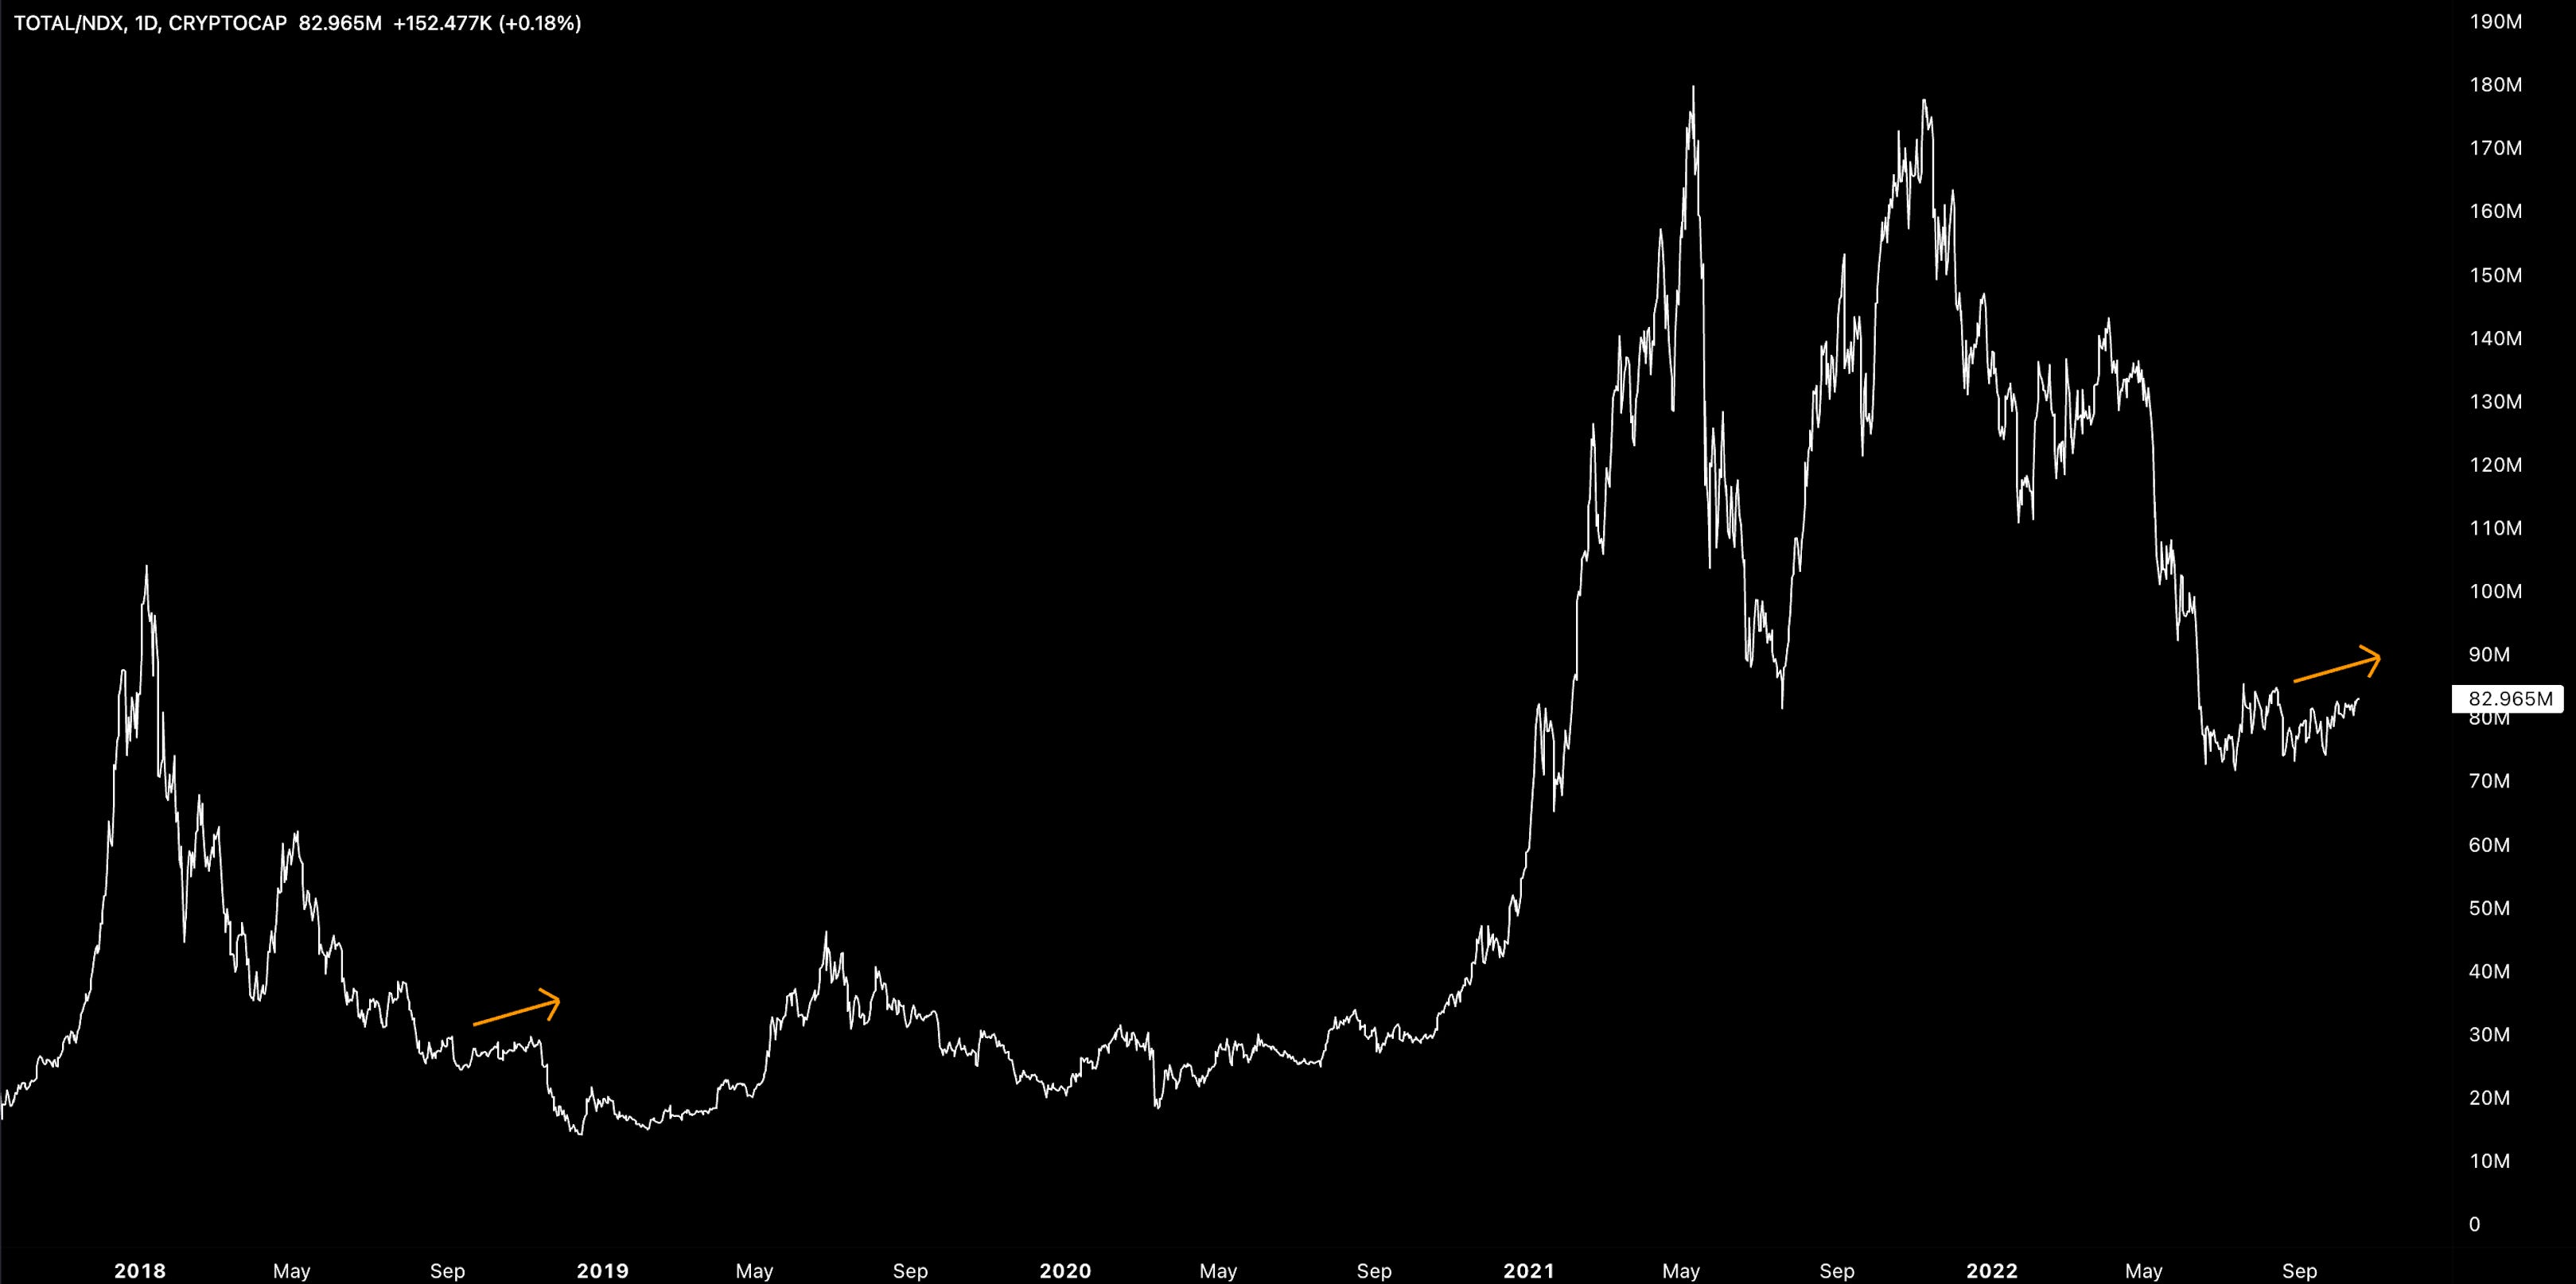
Equities, currencies and bonds are all seeing increased volatility but crypto is, well, doing its own thing. Since mid-July, crypto has been outperforming the NASDAQ 100 by ~15%. Analysis will show that crypto’s range-bound behaviour vs. weakening tech stocks is driving the relationship.
Crypto is holding up well but this also risk investors getting complacent range-bound dynamics
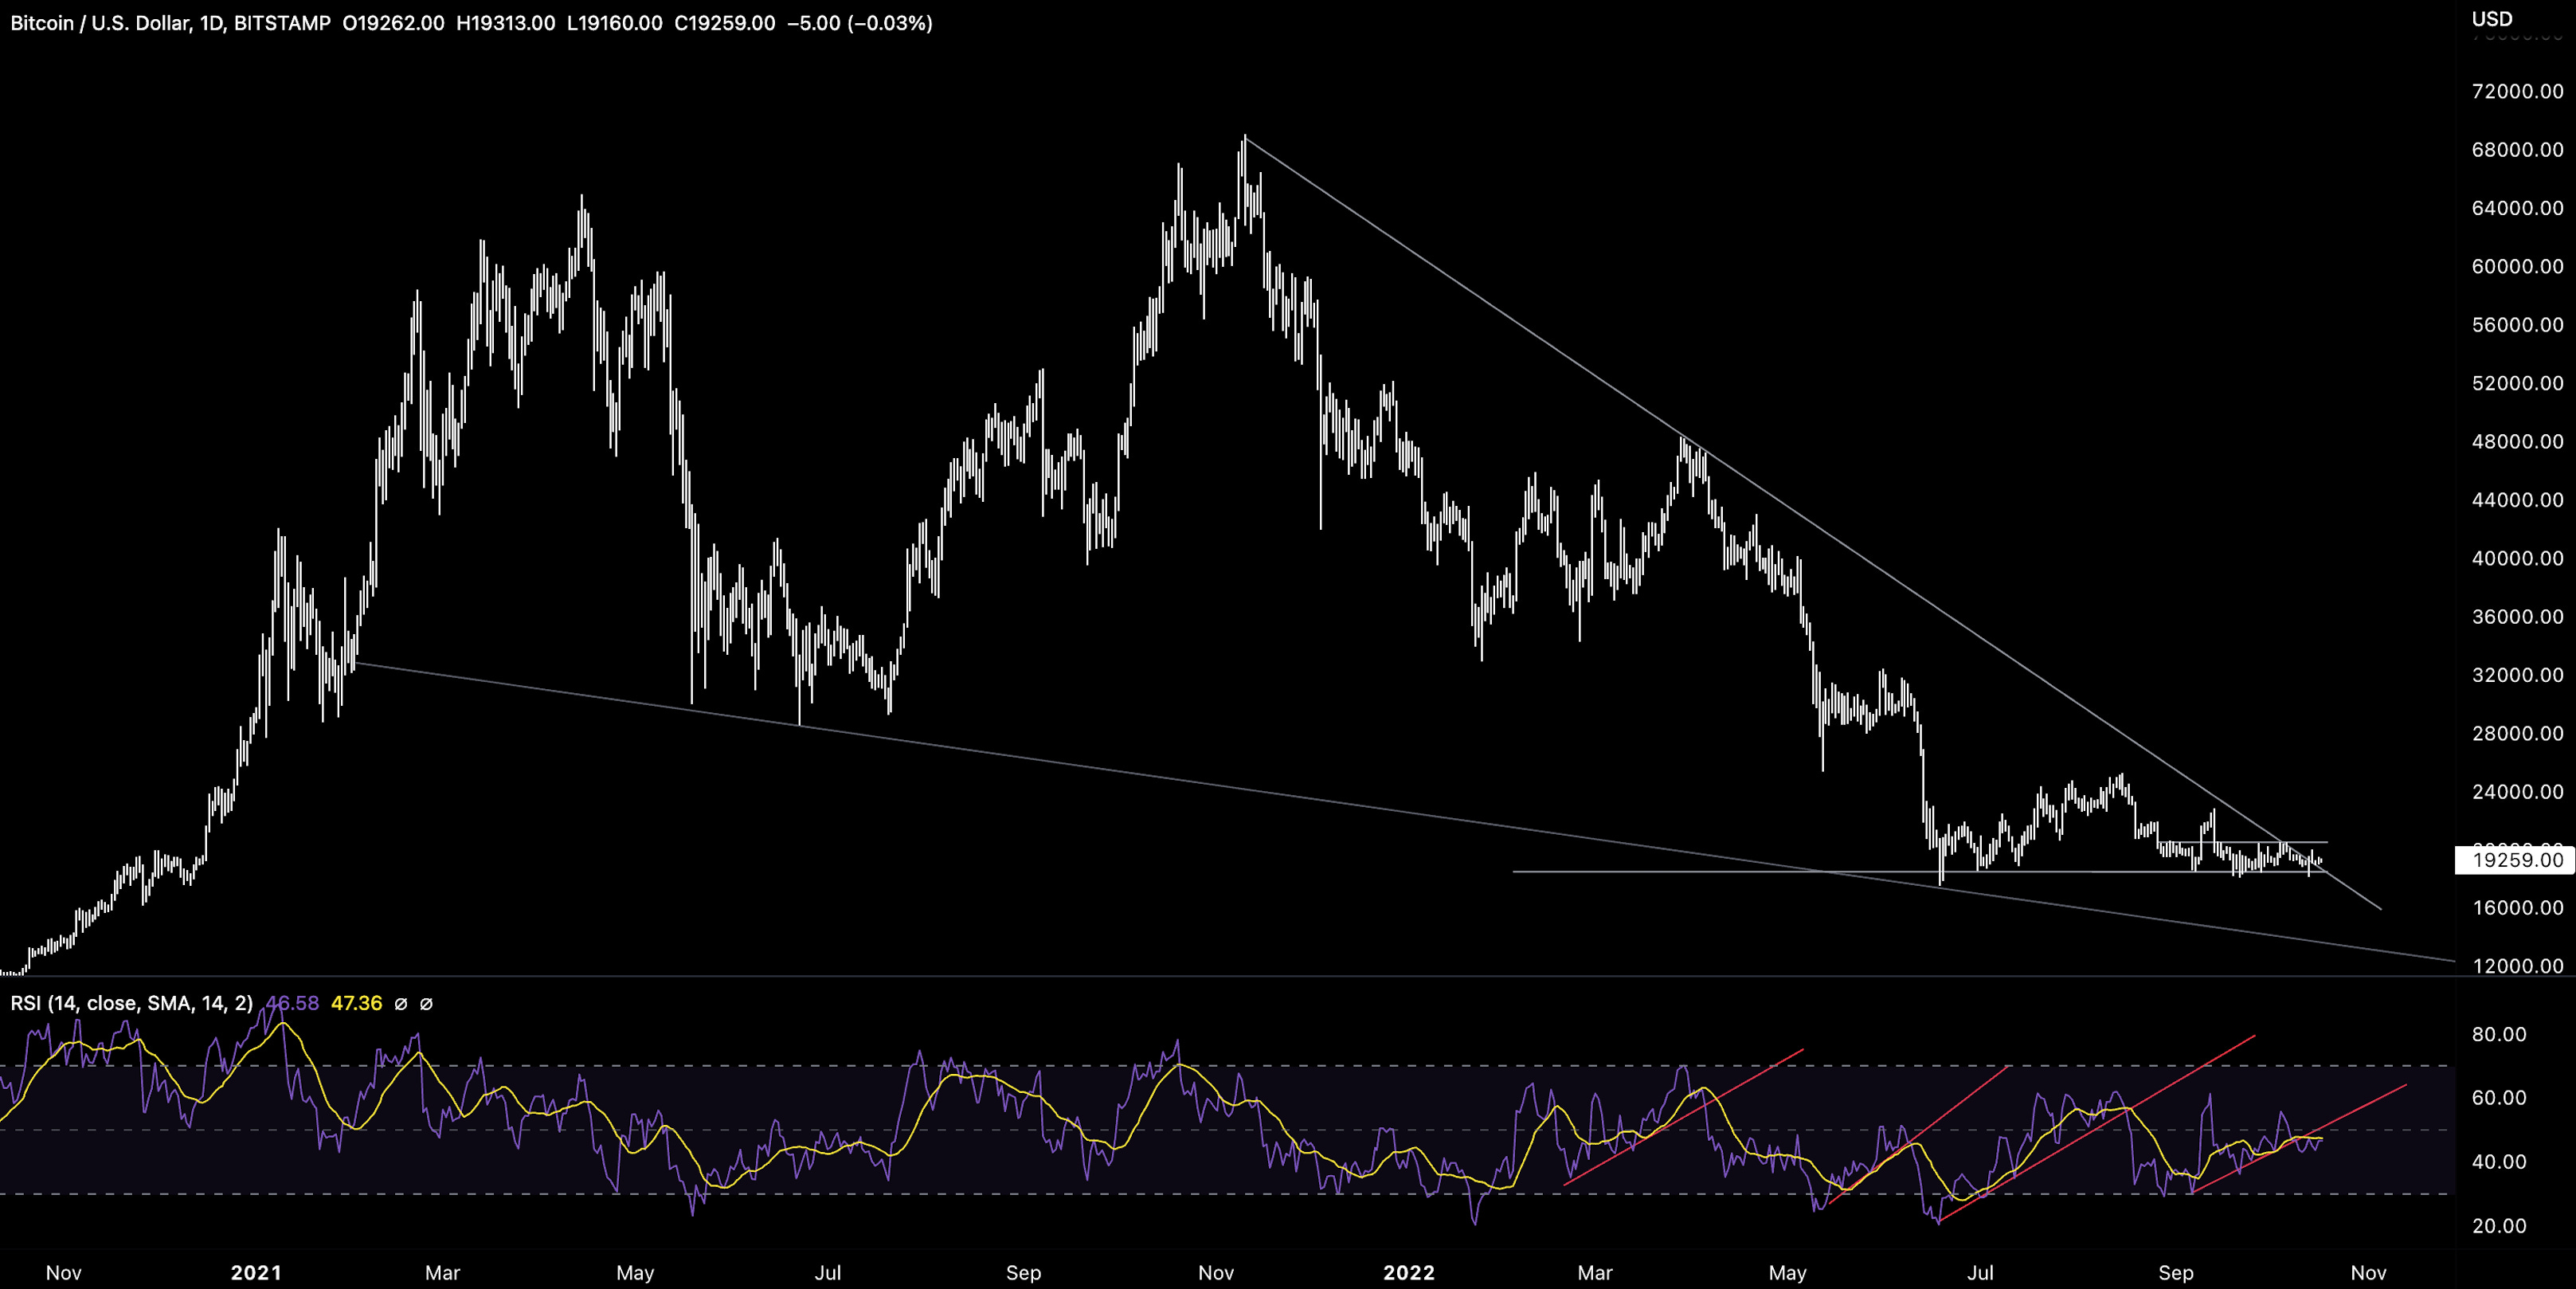
As highlighted last week, this relationship has been exhibited before such as 2018 as BTC was re-testing the $6k level several times before finally breaking down.
For context, BTC spent 280 days at the $6k level, 161 days longer than BTC at this range.
This range-bound dynamic has meant volatility indices for majors like BTC remain at multi-year lows suggesting volatility compression may lead to more significant moves shortly. Note, this can also be seen for ETH too.
The tightening of Bollinger Bands for majors also support this view. MOVE contracts have become more popular allowing traders to bet on volatility without betting on the direction of the market itself.

The level of interest over in the futures market remains very high with open interest (640k BTC) continuing to significantly outpace market cap growth. Funding rates remaining positive indicates a bullish skew in trader positioning.

The OI appears to be consolidated around the $19k level.


This also comes at a time when BTC/USD has broken its falling wedge pattern to the upside - a key signal for traders. Yet, BTC/USD fails to gain any momentum every time it even sniffs $20k.
On-chain metrics like SOPR that only focus on short-term holders show a strong desire to sell as close to cost basis every rally (as indicated by values never breaching above 1 for a sustained period of time).
Perhaps these traders are playing the range game just as much as market makers.

More broadly, exchange volume shows a decline back to descending support as hypothesised throughout this year. Spot is become more illiquid and less relevant compared to its derivatives counterpart.

Alts
It’s not just majors that have seen a lift. DeFi as a ratio of total market capitalization has been buoyed over the past week with the index approaching possible resistance once again.
Those that are short DeFi on a relative basis may get another bite of the apple.

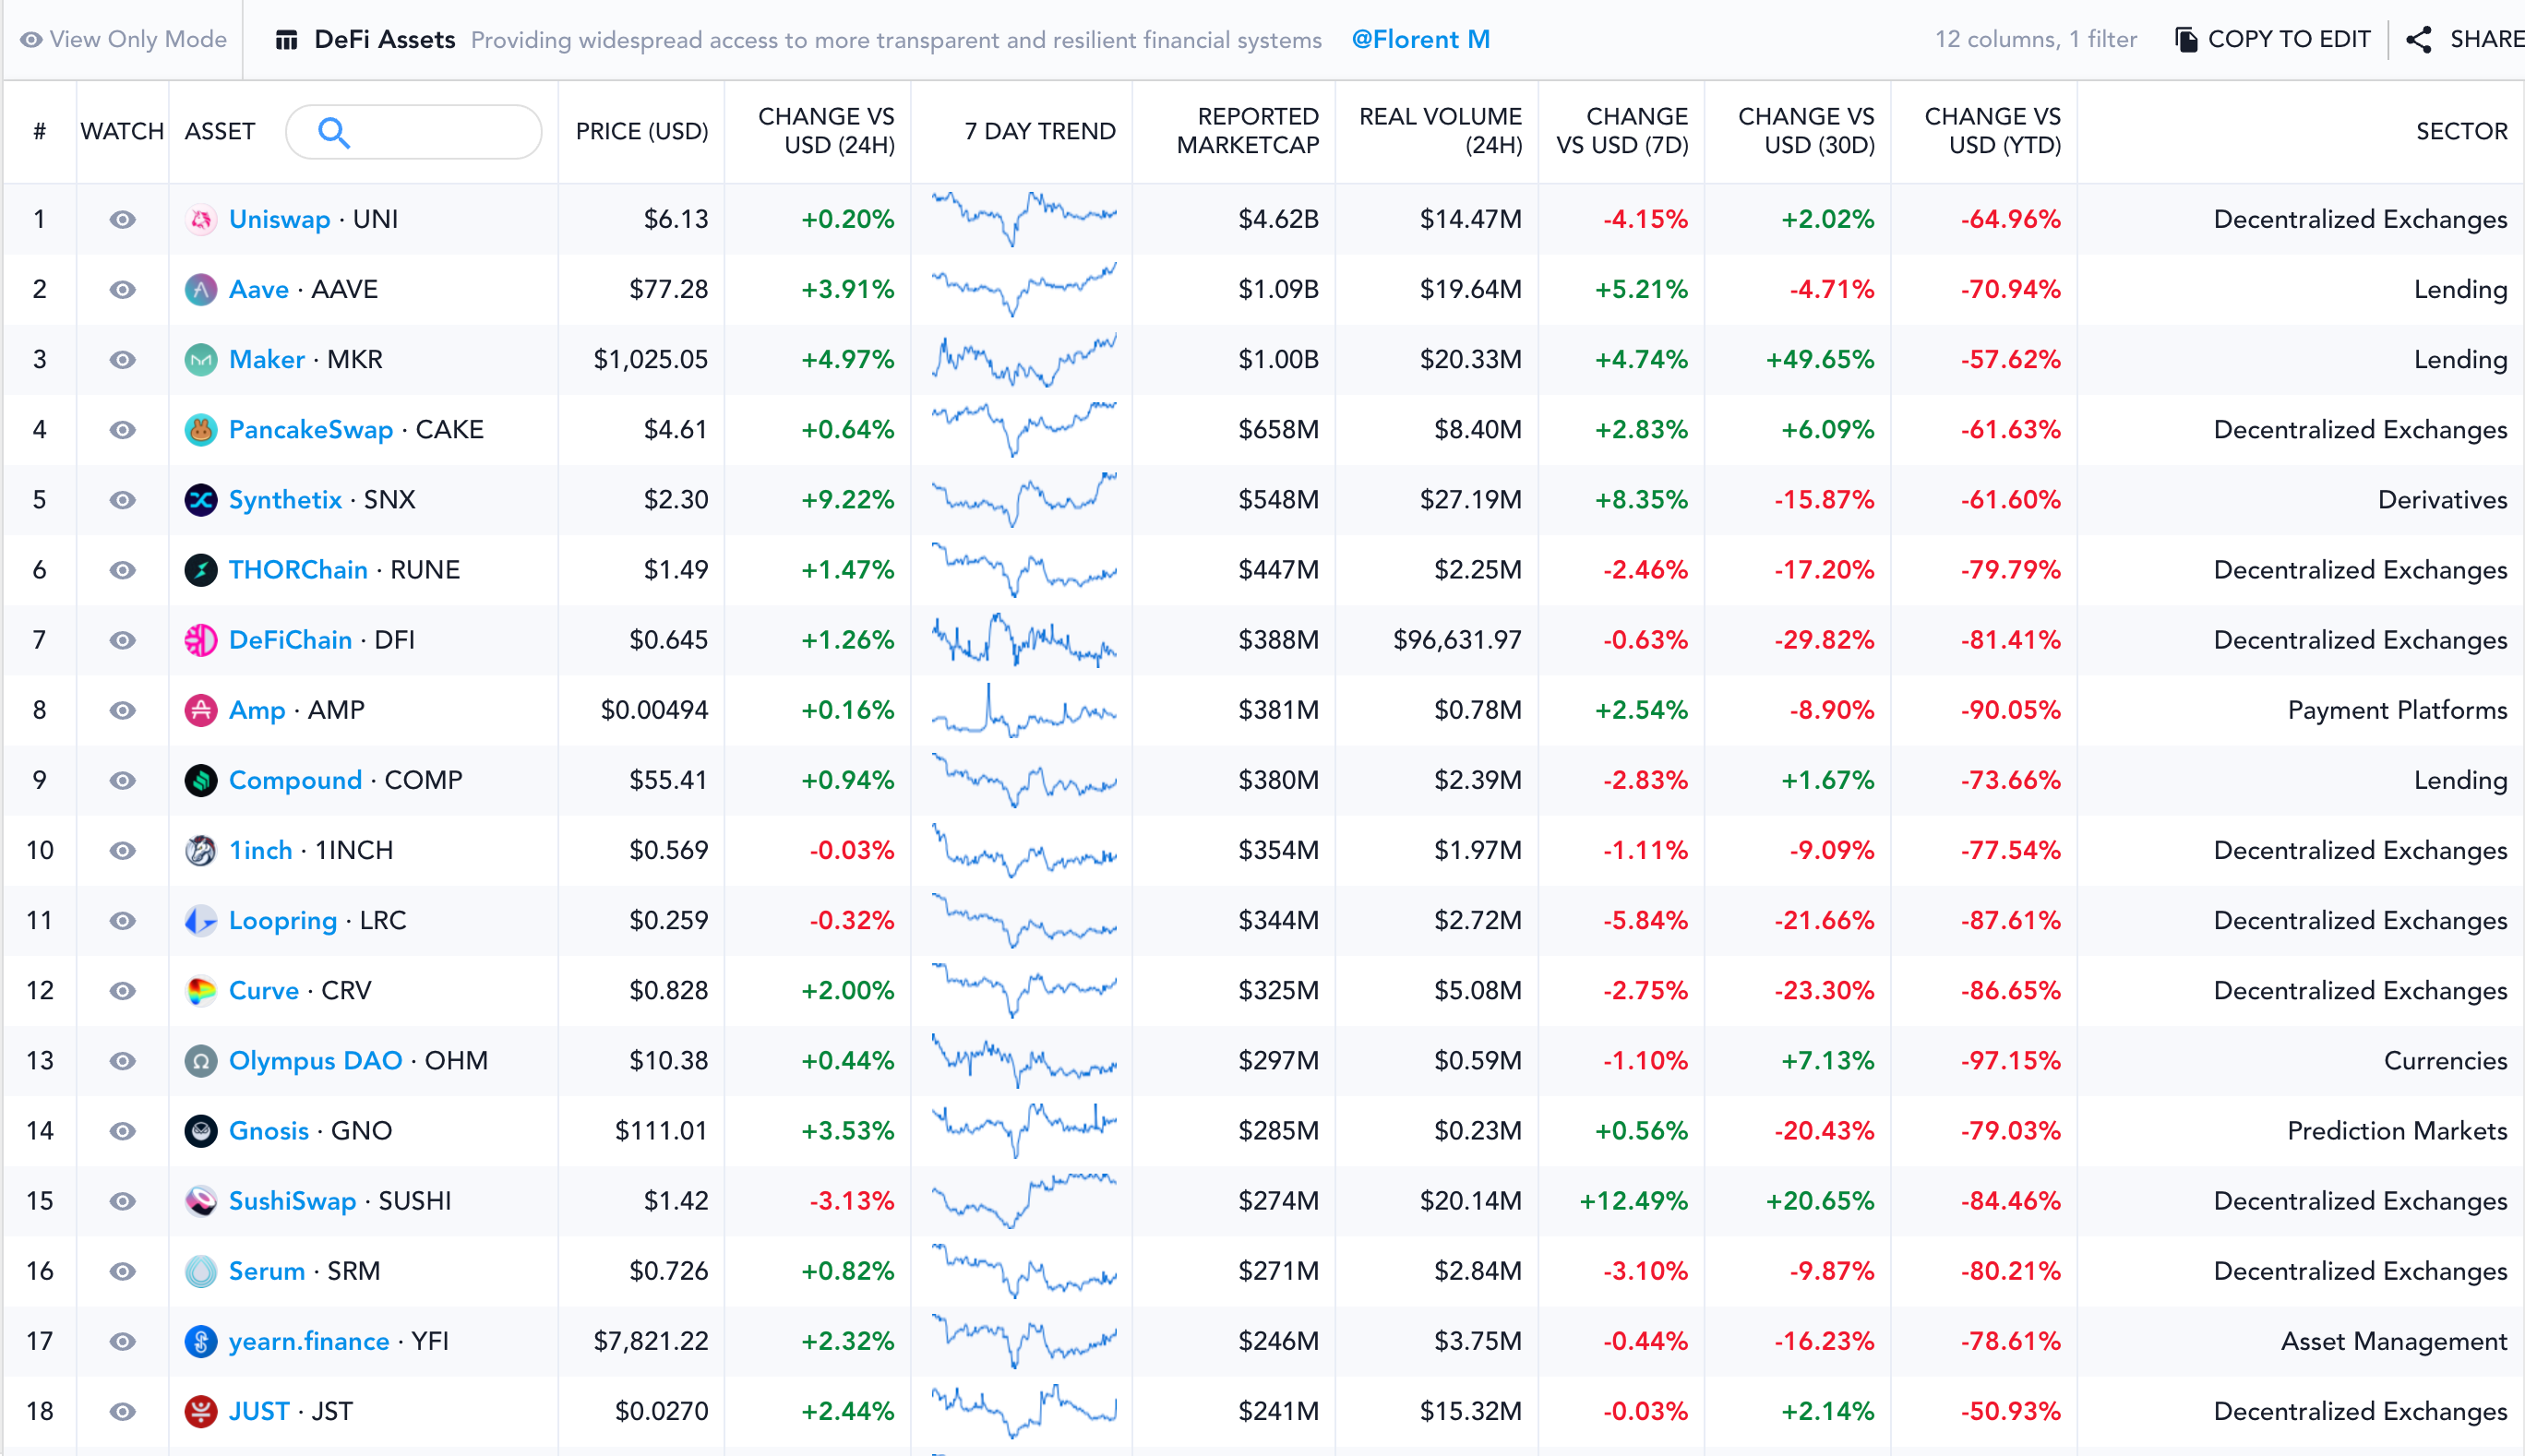
Digging deeper in the numbers shows DeFi not seeing blanket green performance across the board. Weekly performance in the top DeFi names ranges from 15% to -40%.
This is not characteristic of the ‘rising tide lifts all boats dynamics’ we were all too familiar with in 2020-2021.
DeFi may be keeping level on a relative basis but on a USD denominated basis there is less consistency. The involvement of more opportunistic traders has meant broad performance has become increasingly tricky. Don’t be fooled - this is a wary, and skittish market.
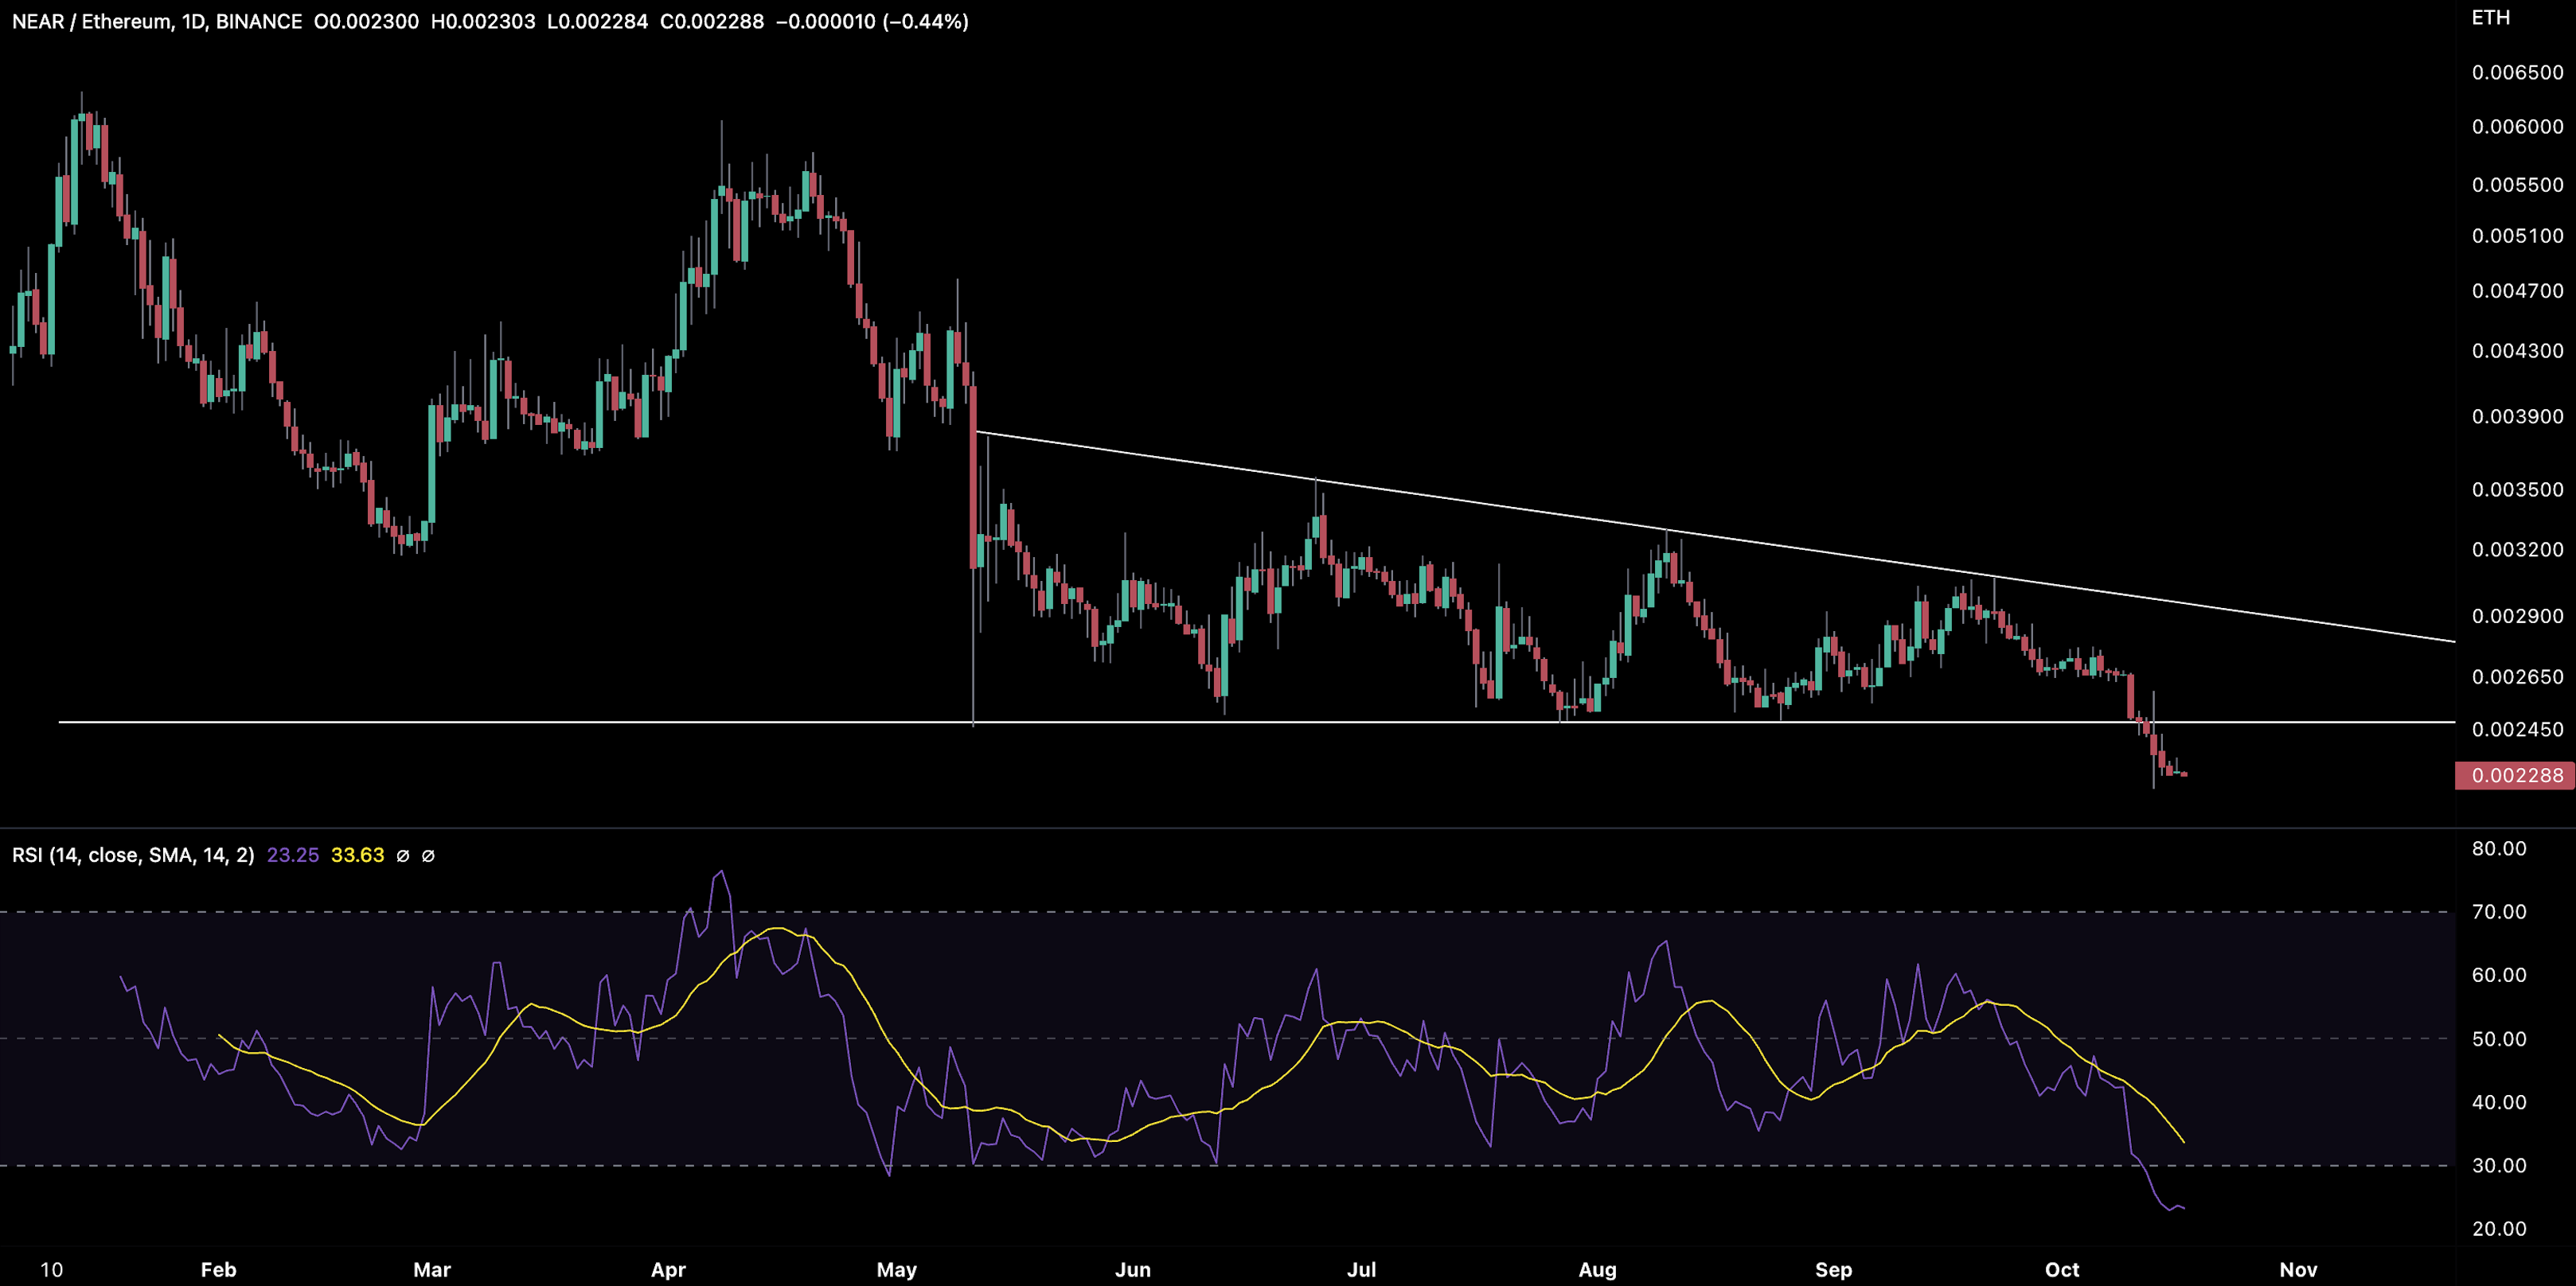
This thinking is also supported in the higher-cap names too. NEAR/ETH has broken below key support by 8%.
Putting the puzzle pieces together and we may conclude that capital is flowing back to BTC and ETH because they are exhibiting range-bound behaviour. The need for stability or relative performance (spread trades) for traders may be what is reinforcing BTC and ETH strength in the market.
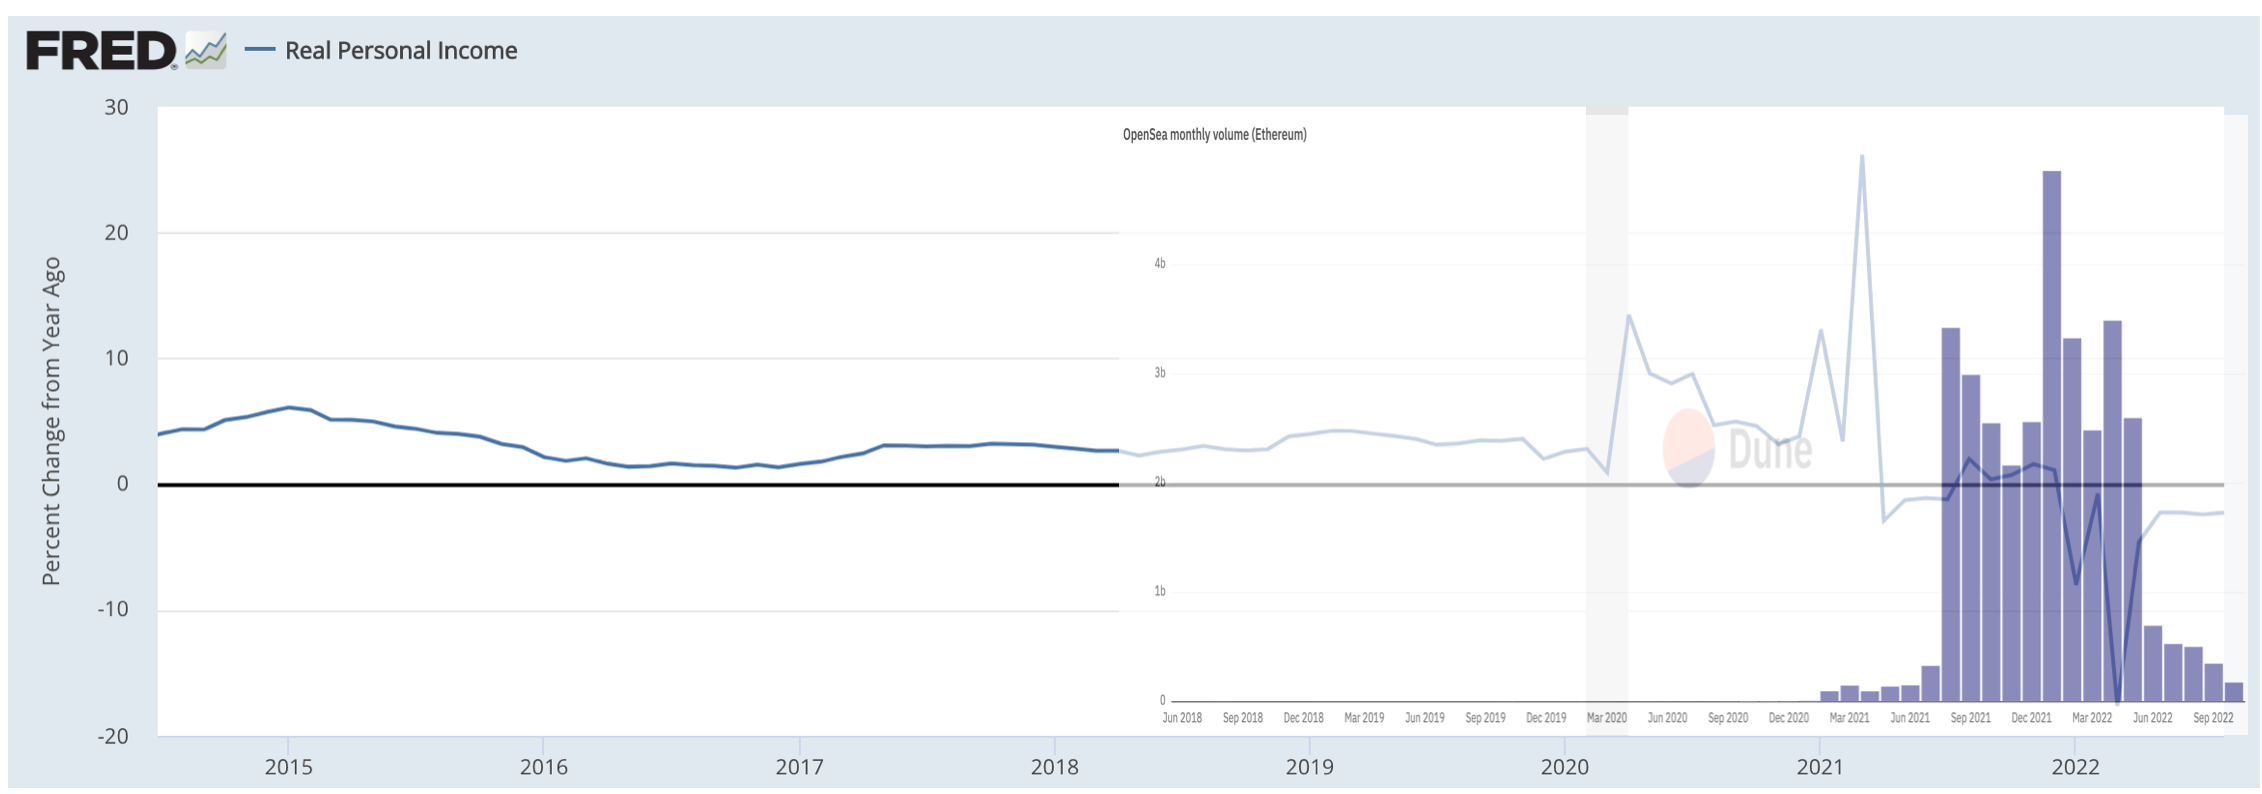
As for one of the highest risk sector, NFTs, trading volumes have fallen 90%+ from their peaks in 2022. The outlook remains bleak with liquidity constraints and disposable spending being squeezed further.
The rate of change of real personal income has likely impacted speculative interest in NFTs with the former remaining firmly negative. The need for higher unemployment will only make things worse.
Note, using spot volumes as a proxy measure for retail interest may also colour why the trend is down while more sophisticated investors drive derivative metrics higher.
So where do we stand?
We are seeing resilience in select crypto majors regardless of the broader macro turbulence. More sophisticated traders who are becoming more opportunistic in their positioning are the ones moving markets.
Volatility compression can only last for so long and it feels that something has to give at some point.
The more crypto trades at these levels while equities like the S&P 500 potentially fall closer to 3,000-3,200, the more constructive the market will arguably be for longer-term positioning.
On the flip side, any sharp drawdowns in equities may be the final straw for crypto with the market realising crypto needs a reset on a relative basis.
Right now though, I continue to view the market with a more skeptical lens.
Decentral Park Market Pulse
Want real time updates and analysis on the digital asset market? Join Decentral Park’s Market Pulse group by clicking the link below:

Top performers over the past week are largely speculative/headline driven:
Top 100 (7d %):
Huobi (+78.6%)
Quant (+36.1%)
Casper Network (+29.2%)
Frax Share (+18.9%)
Arweave (+12.7%)
DeFi Top 100 MCAPs (7d %):
BoringDAO (+26.7%)
Ribbon Finance (+23.8%)
Frax Share (+18.9%)
dYdX (+14.0%)
Perpetual Protocol (+13.5%)
Stride doubled STRD rewards for stATOM / ATOM pool on Osmosis, current APR is 68% (2 weeks bond).
Beefy launched a vault for USDC / DAI / USDT Curve pool on Kava with 9.5% APR.
Hop OP bridge rewards are now up for claim, 5000 tokens will be distributed this week.
Stake DAO introduced 6 new strategies for liquid lockers, including agEUR/FRAXBP (11%) and yCRV (26%)
Global Market Cap
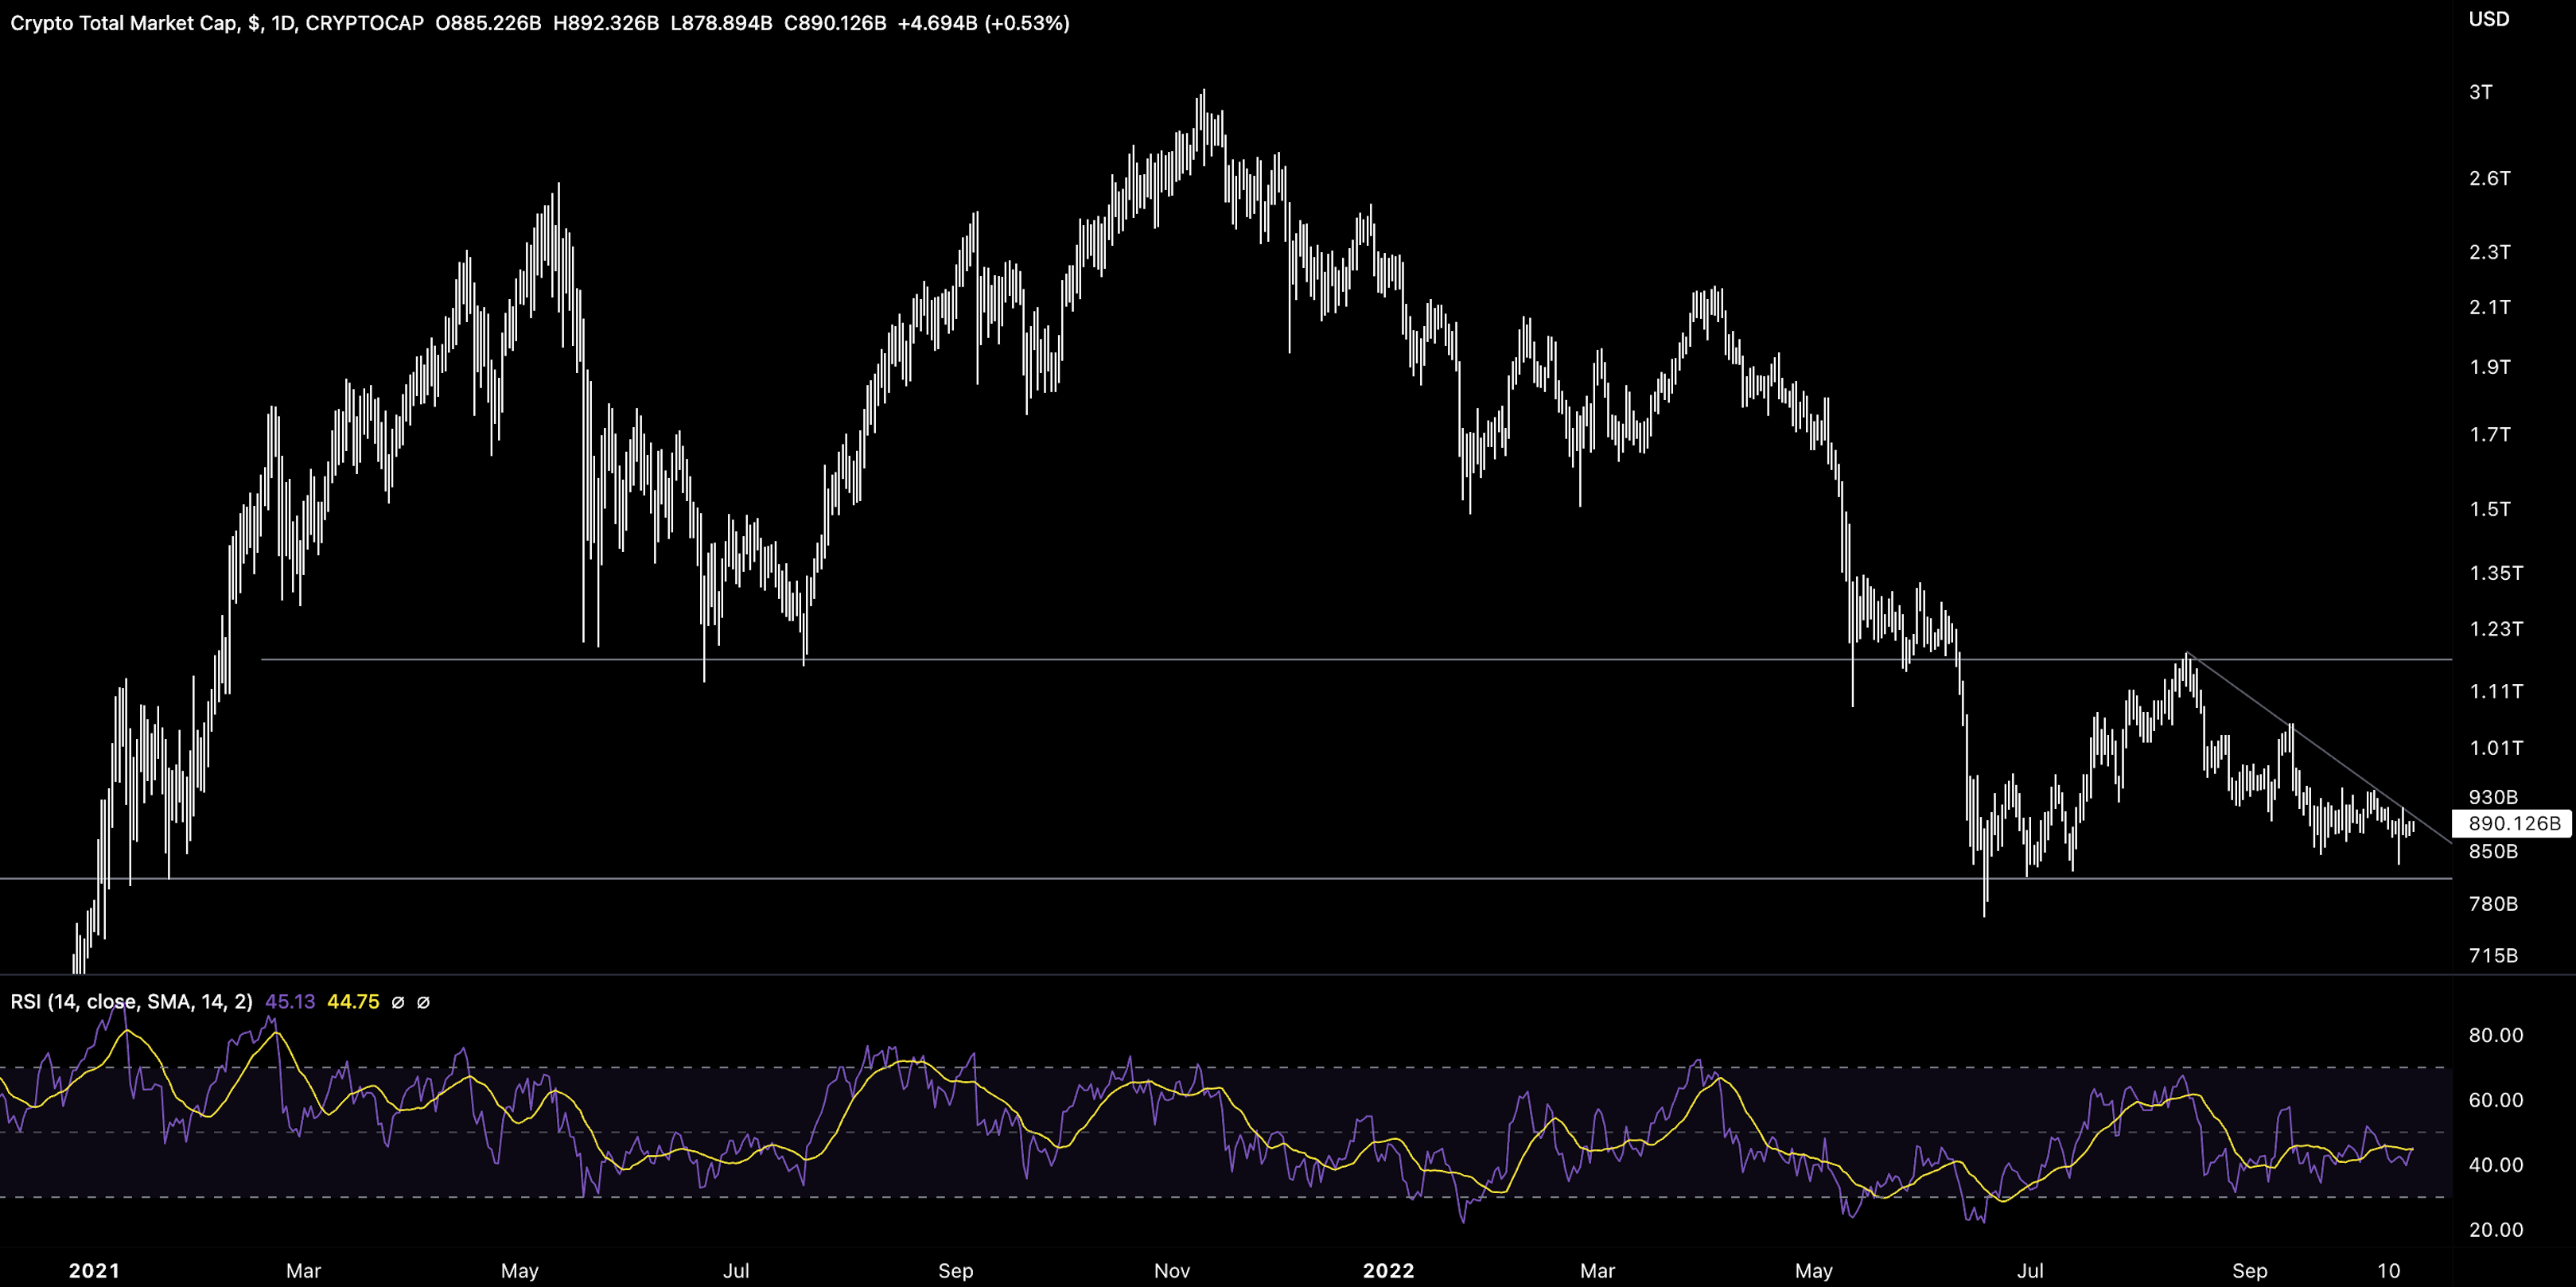
$890B; Global market cap fell 2.2% last week but firmly remains within channel. About to test wedge.
DeFi MCAP

$41.4B; DeFi market cap increased slightly by 3% last week. Still kept range bound between $43B and $60B.

4.65%; DeFi market cap dominance at 4.65% and largely flat over the past 7 days.
Bitcoin Dominance

41.73%; Bitcoin dominance ticking higher slightly but facing resistance at 42%.
Trader Positioning


Short end IVs ticking lower, below long end. IV dumping continues. Traders short vol. BTC <40v doesn’t last too long.
BTC put/call 0.5 with ETH at 0.22.

Aggregate funding rates for BTC remaining positive while ETH seeing more indecisive (currently negative) positioning.


Grayscale GBTC

GBTC discount to NAV keeping at all-time-highs (36.47%). 30D volumes keeping flat at 2.98M.

Sharp increase in ETHE discount to NAV as ETHE is offloaded by investors. 30D volumes falling to new lows (2.656m).
Volumes


Spot volumes falling to new annual lows last week of $14.58B. On-chain transfer volume for BTC also falling to new annual lows (1.97m BTC) with the network being used less and less.
Aggregate Order Books
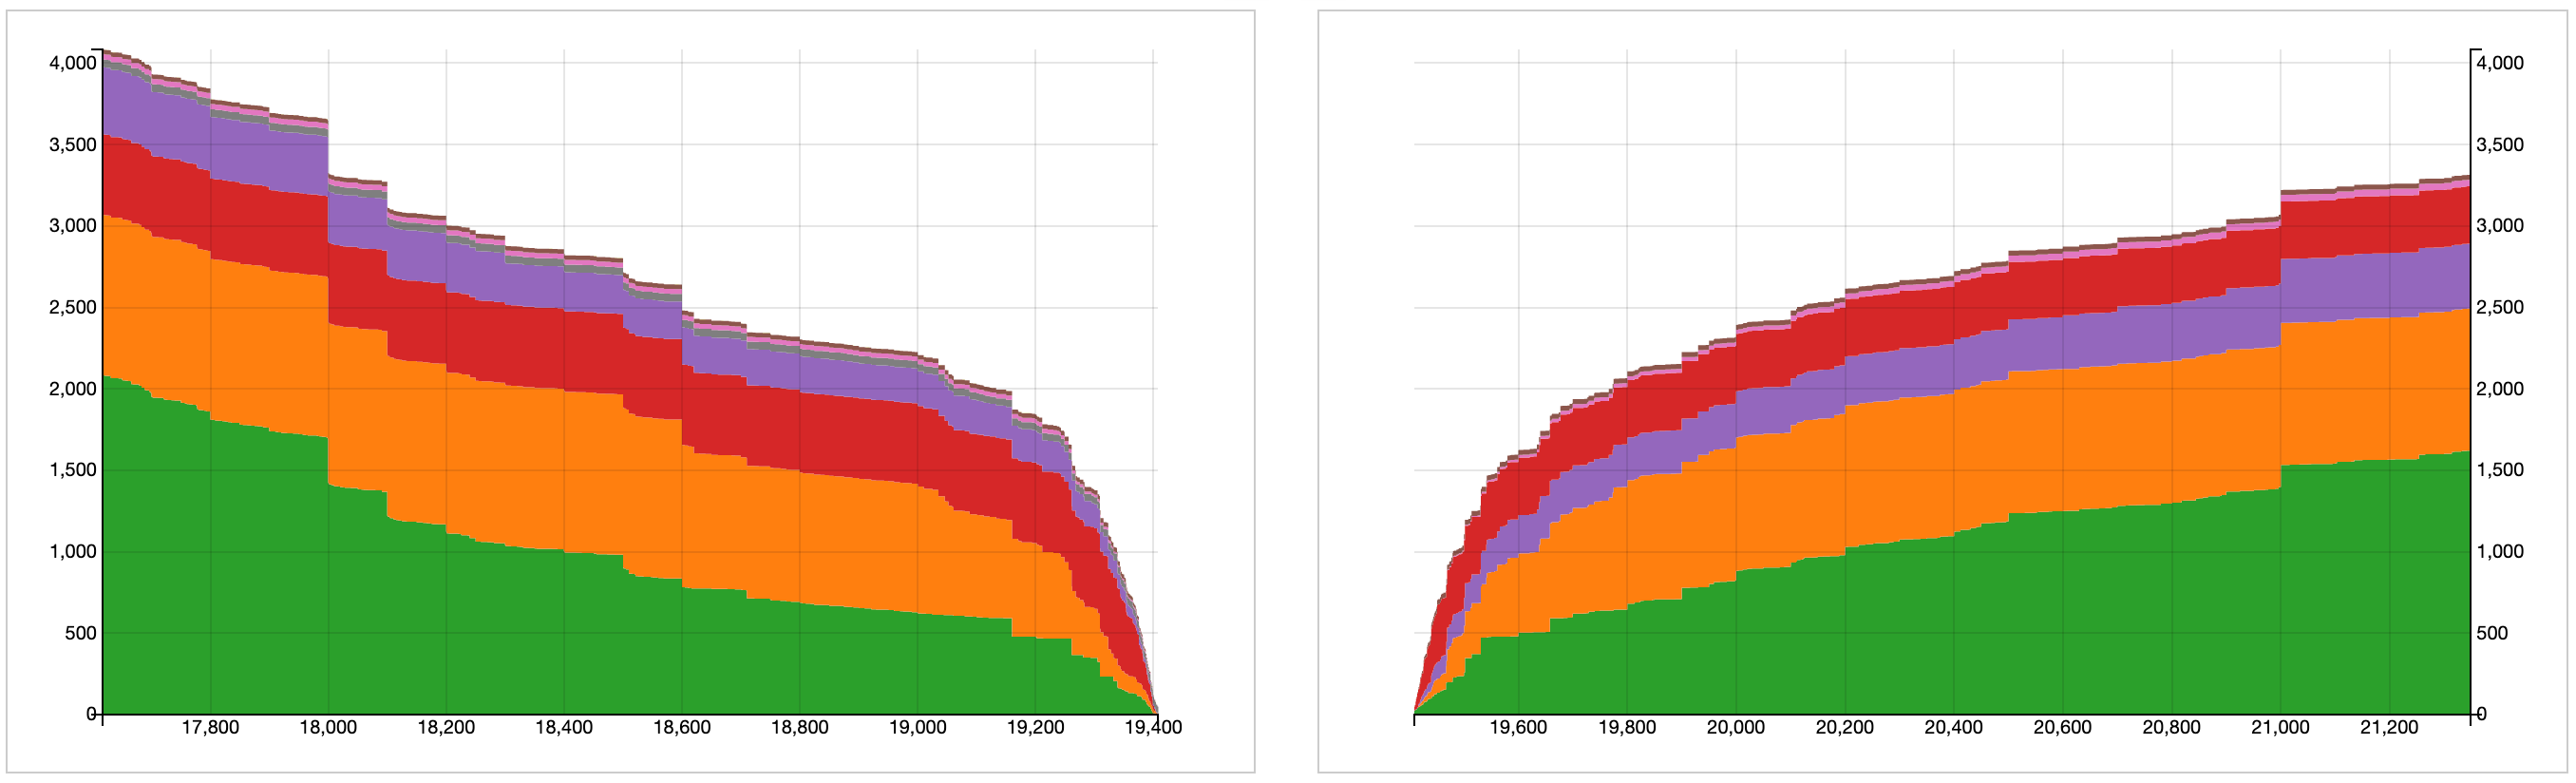
Order books looks slightly heavier on the bid side. Heavier resistance up to $20k.
Miners


Miners continue to be squeezed with hash rate continuing to climb to new all-time-highs. This comes as Binance announces $500m financial support for mining companies including ones operating for the Bitcoin network.
Bitcoin production cost puts a wick floor of $16.1k for BTC/USD.
📚 DeFi Spotlight Q3 2022 [Coinshares]
📚 Liquidity Reversals [Lyn Alden]
📚 Our Network #142 [Our Network]
📚 October and Risk Markets [Raoul Pal]
📚 European VCs are finally launching crypto funds — what took them so long? [The Block]
🎙️ Market Vibez, Solana’s Mango Exploit & ZK Scaling Season [Empire]
🎙️ Are Regulators Spending Too Much Time on Crypto? [The Breakdown]
🎙️ Censorship Resistance and Credible Neutrality [Epicenter]
🎙️ The ‘culture of excess; in crypto lending is over [The Scoop]
🎙️ The Rise of the Global Dollar System [Hidden Forces]
The information above does not constitute an offer to sell digital assets or a solicitation of an offer to buy digital assets. None of the information here is a recommendation to invest in any securities.