


Join the 1000’s of founders, investors, crypto funds, brokerage firms, and developers in getting free cutting edge crypto research by subscribing below:
Entering the Eye of the Storm
The crypto markets have done little over the past week as investors continue to grapple with a wide range of macro and geopolitical issues.
It’s almost too quiet for comfort.
Global MCAP has chopped around the $900B mark for some time and remains firmly within its channel (817B-$1.174T).

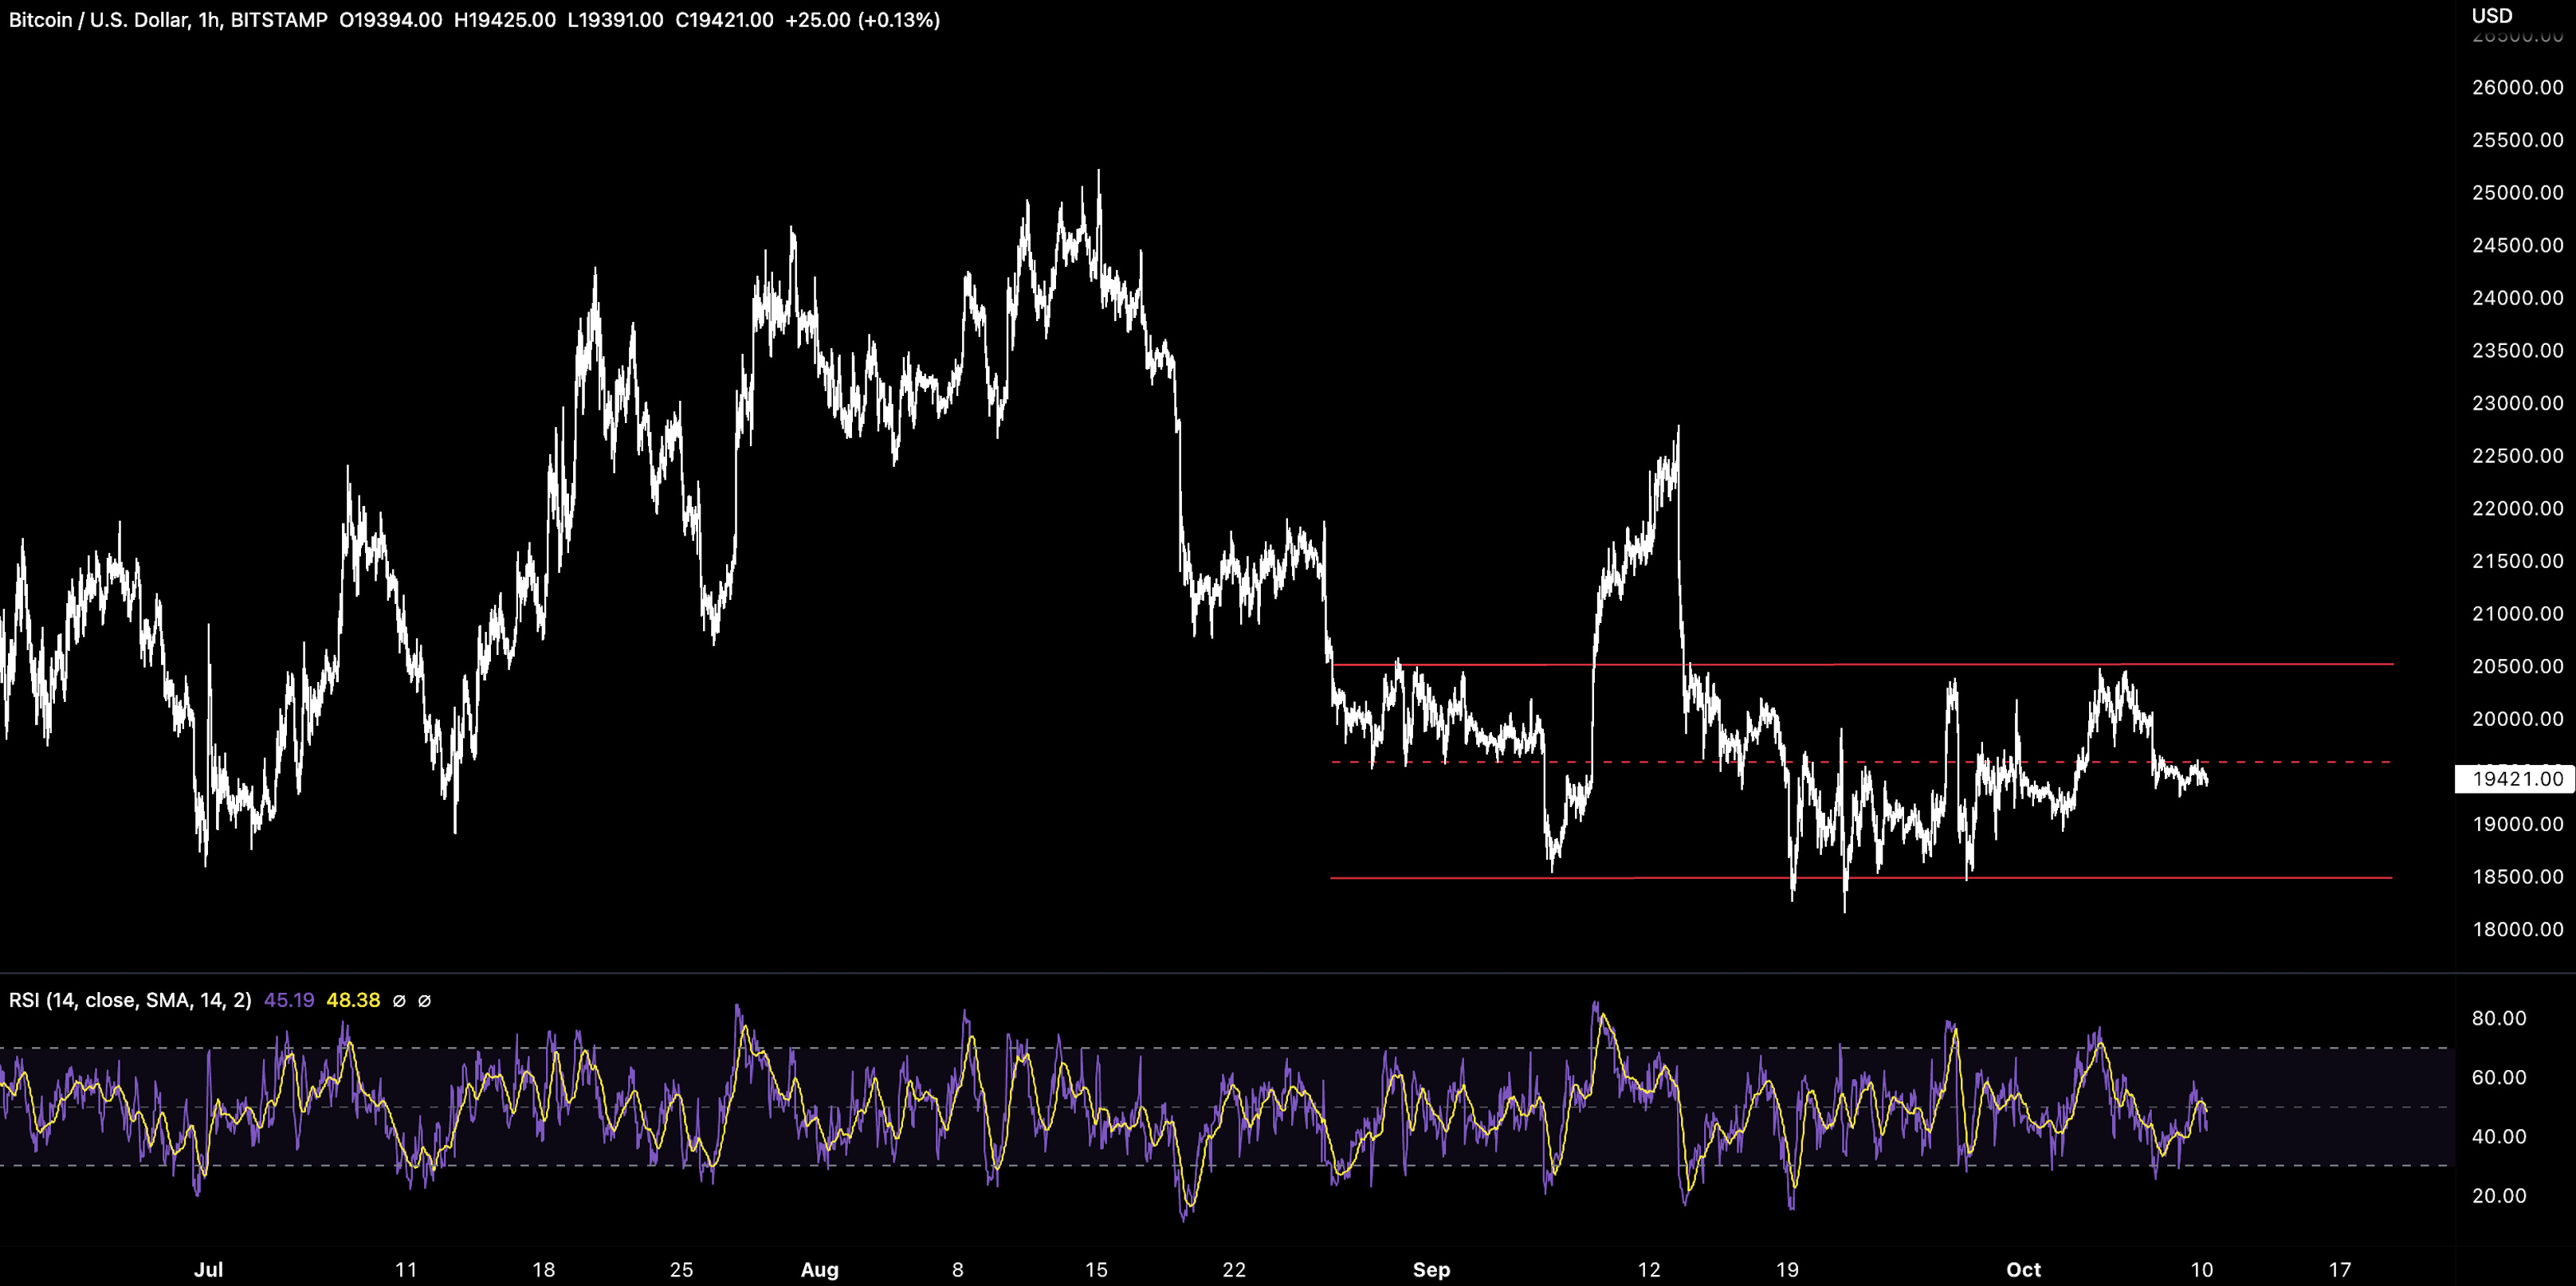
BTC/USD mirrors the same pattern, keeping within a clear $18.5k-$20.5k. Momentum indicators like RSI do not show any clear divergences on the daily/weekly and remain neutral for now.
Shorts appear to be piling in on the derivatives for BTC and ETH side but have so far been safe from any rising prices.
DeFi/Total index is now reaching the top of its descending channel with deviation from historical trends being driven by the merge and select cryptoassets driving performance in recent days (SUSHI, MKR).

Alt L1s against their ETH ratio have failed to pick up sustained bullish momentum over October. Any momentum seen (e.g. ATOM) is now being evaporated.
Capital is flowing less to these majors on a relative basis and indicates a generally low risk appetite by traders who are being more selective in their plays.

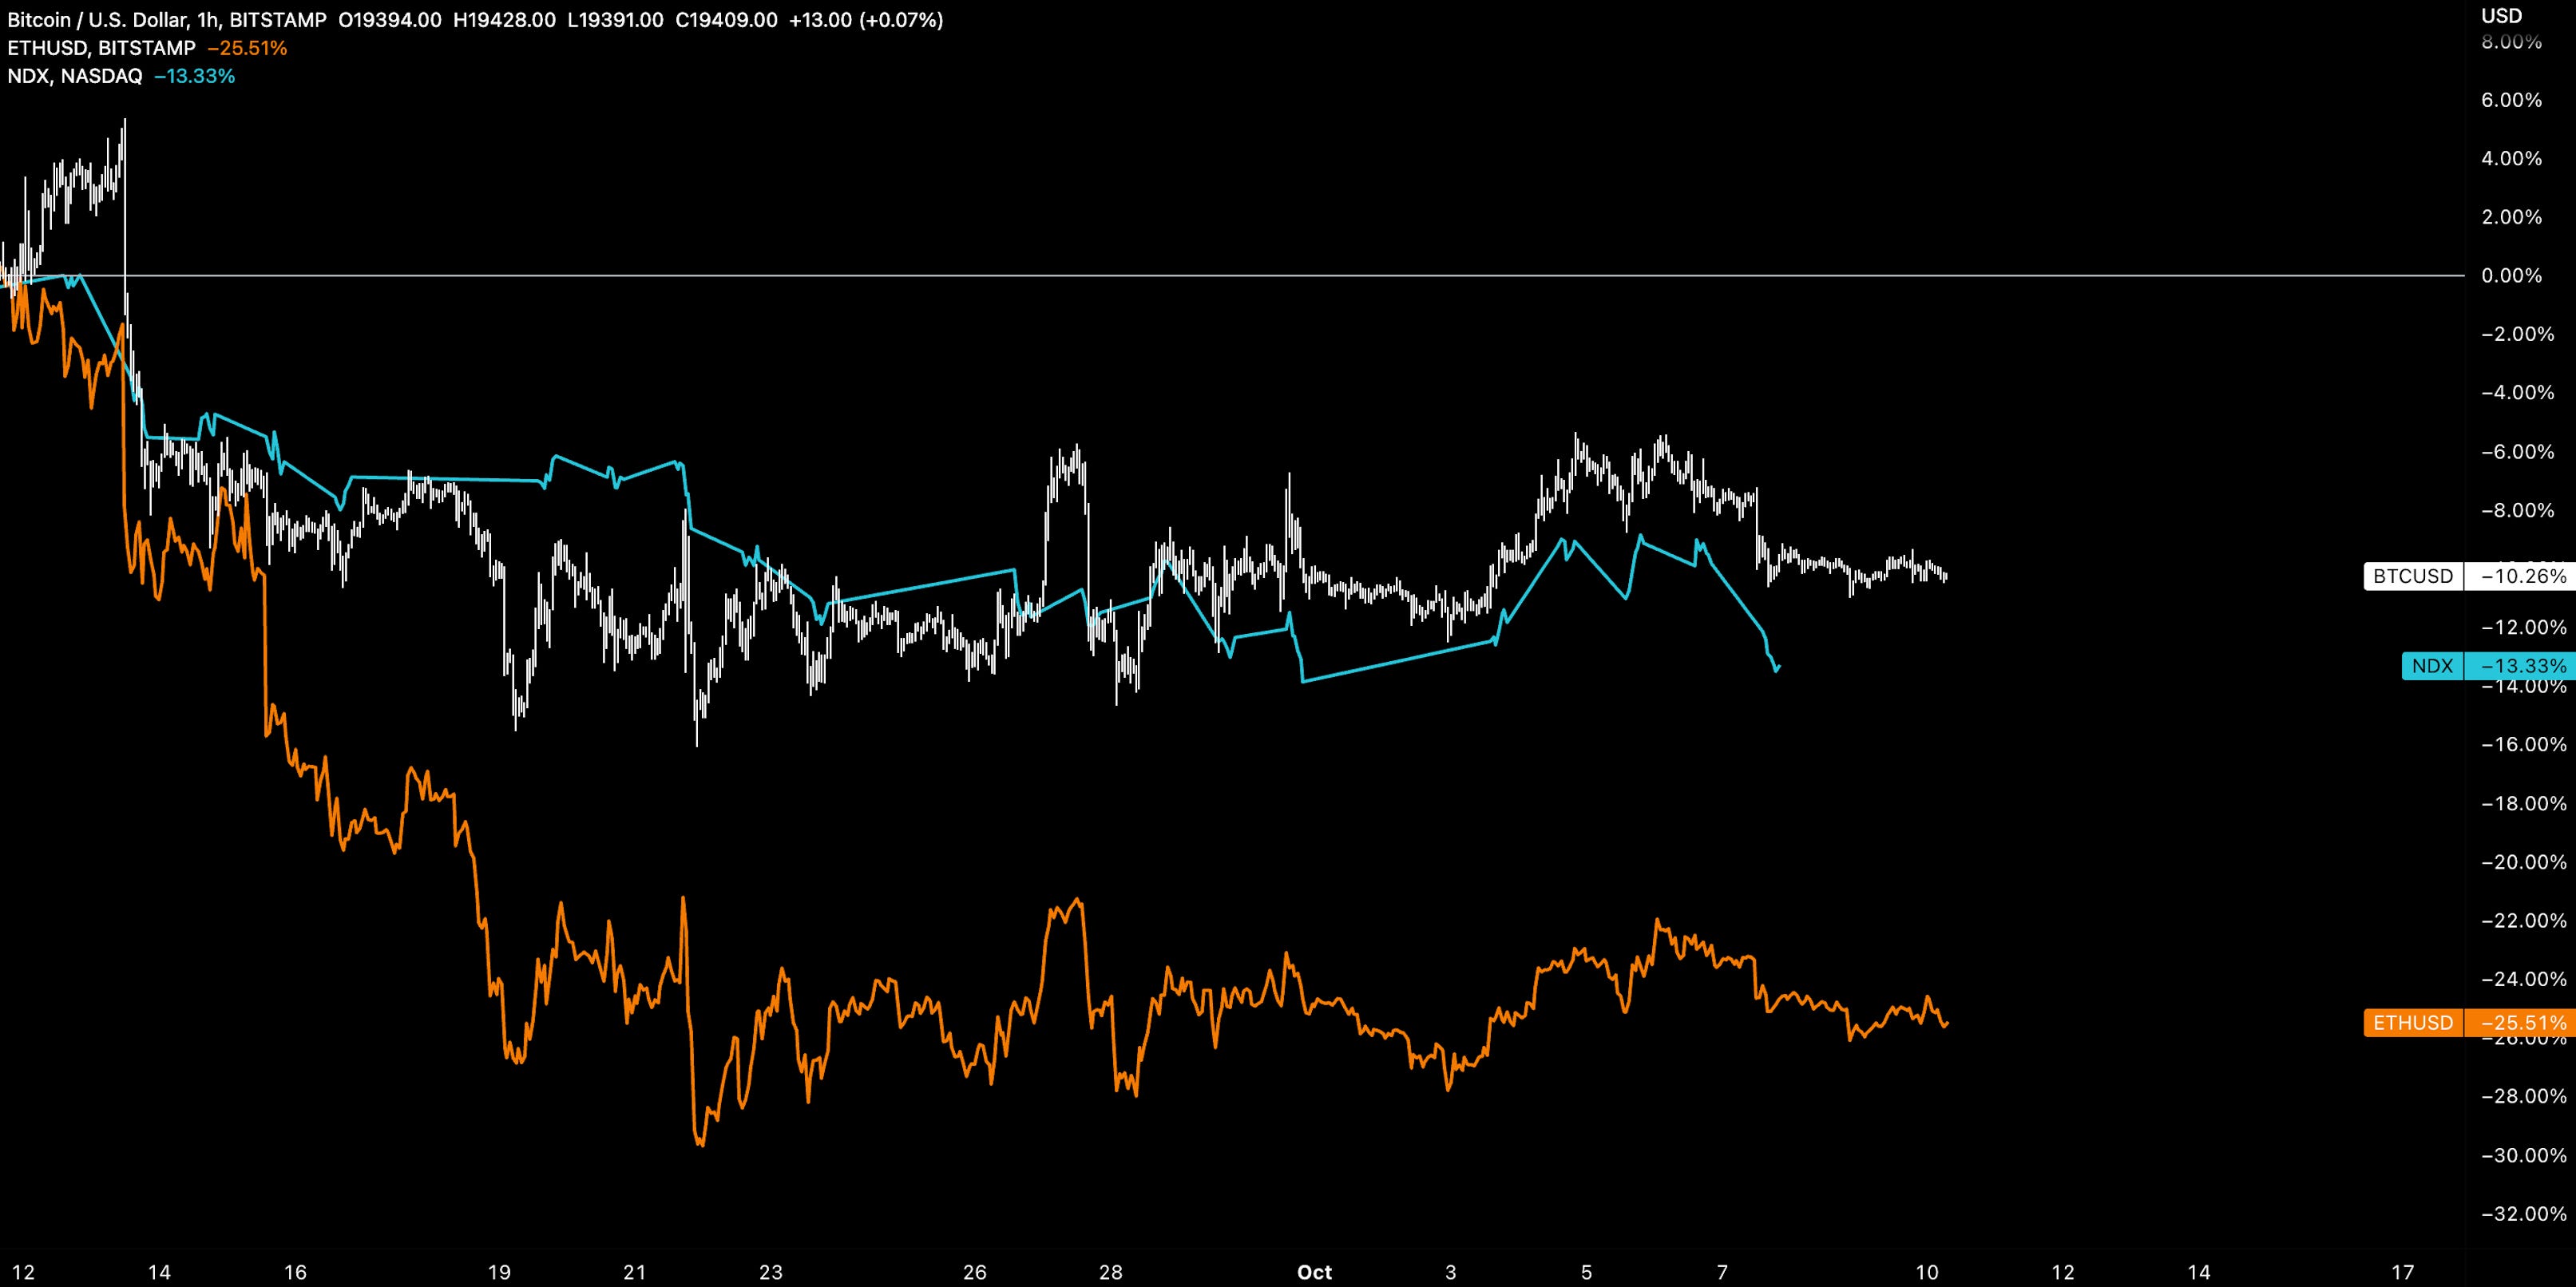
Majors like BTC/USD have held up relatively well compared to tech stocks over the past month, outperforming by ~3%.
Other majors like ETH/USD faces idiosyncratic selling post-merge as traders unwound their positions. There are two key takeaways here:
During a red period, select cryptoassets can outperform high growth tech on a relative basis
Bitcoin is seeing reasonable buy support in the $18k-$20k range
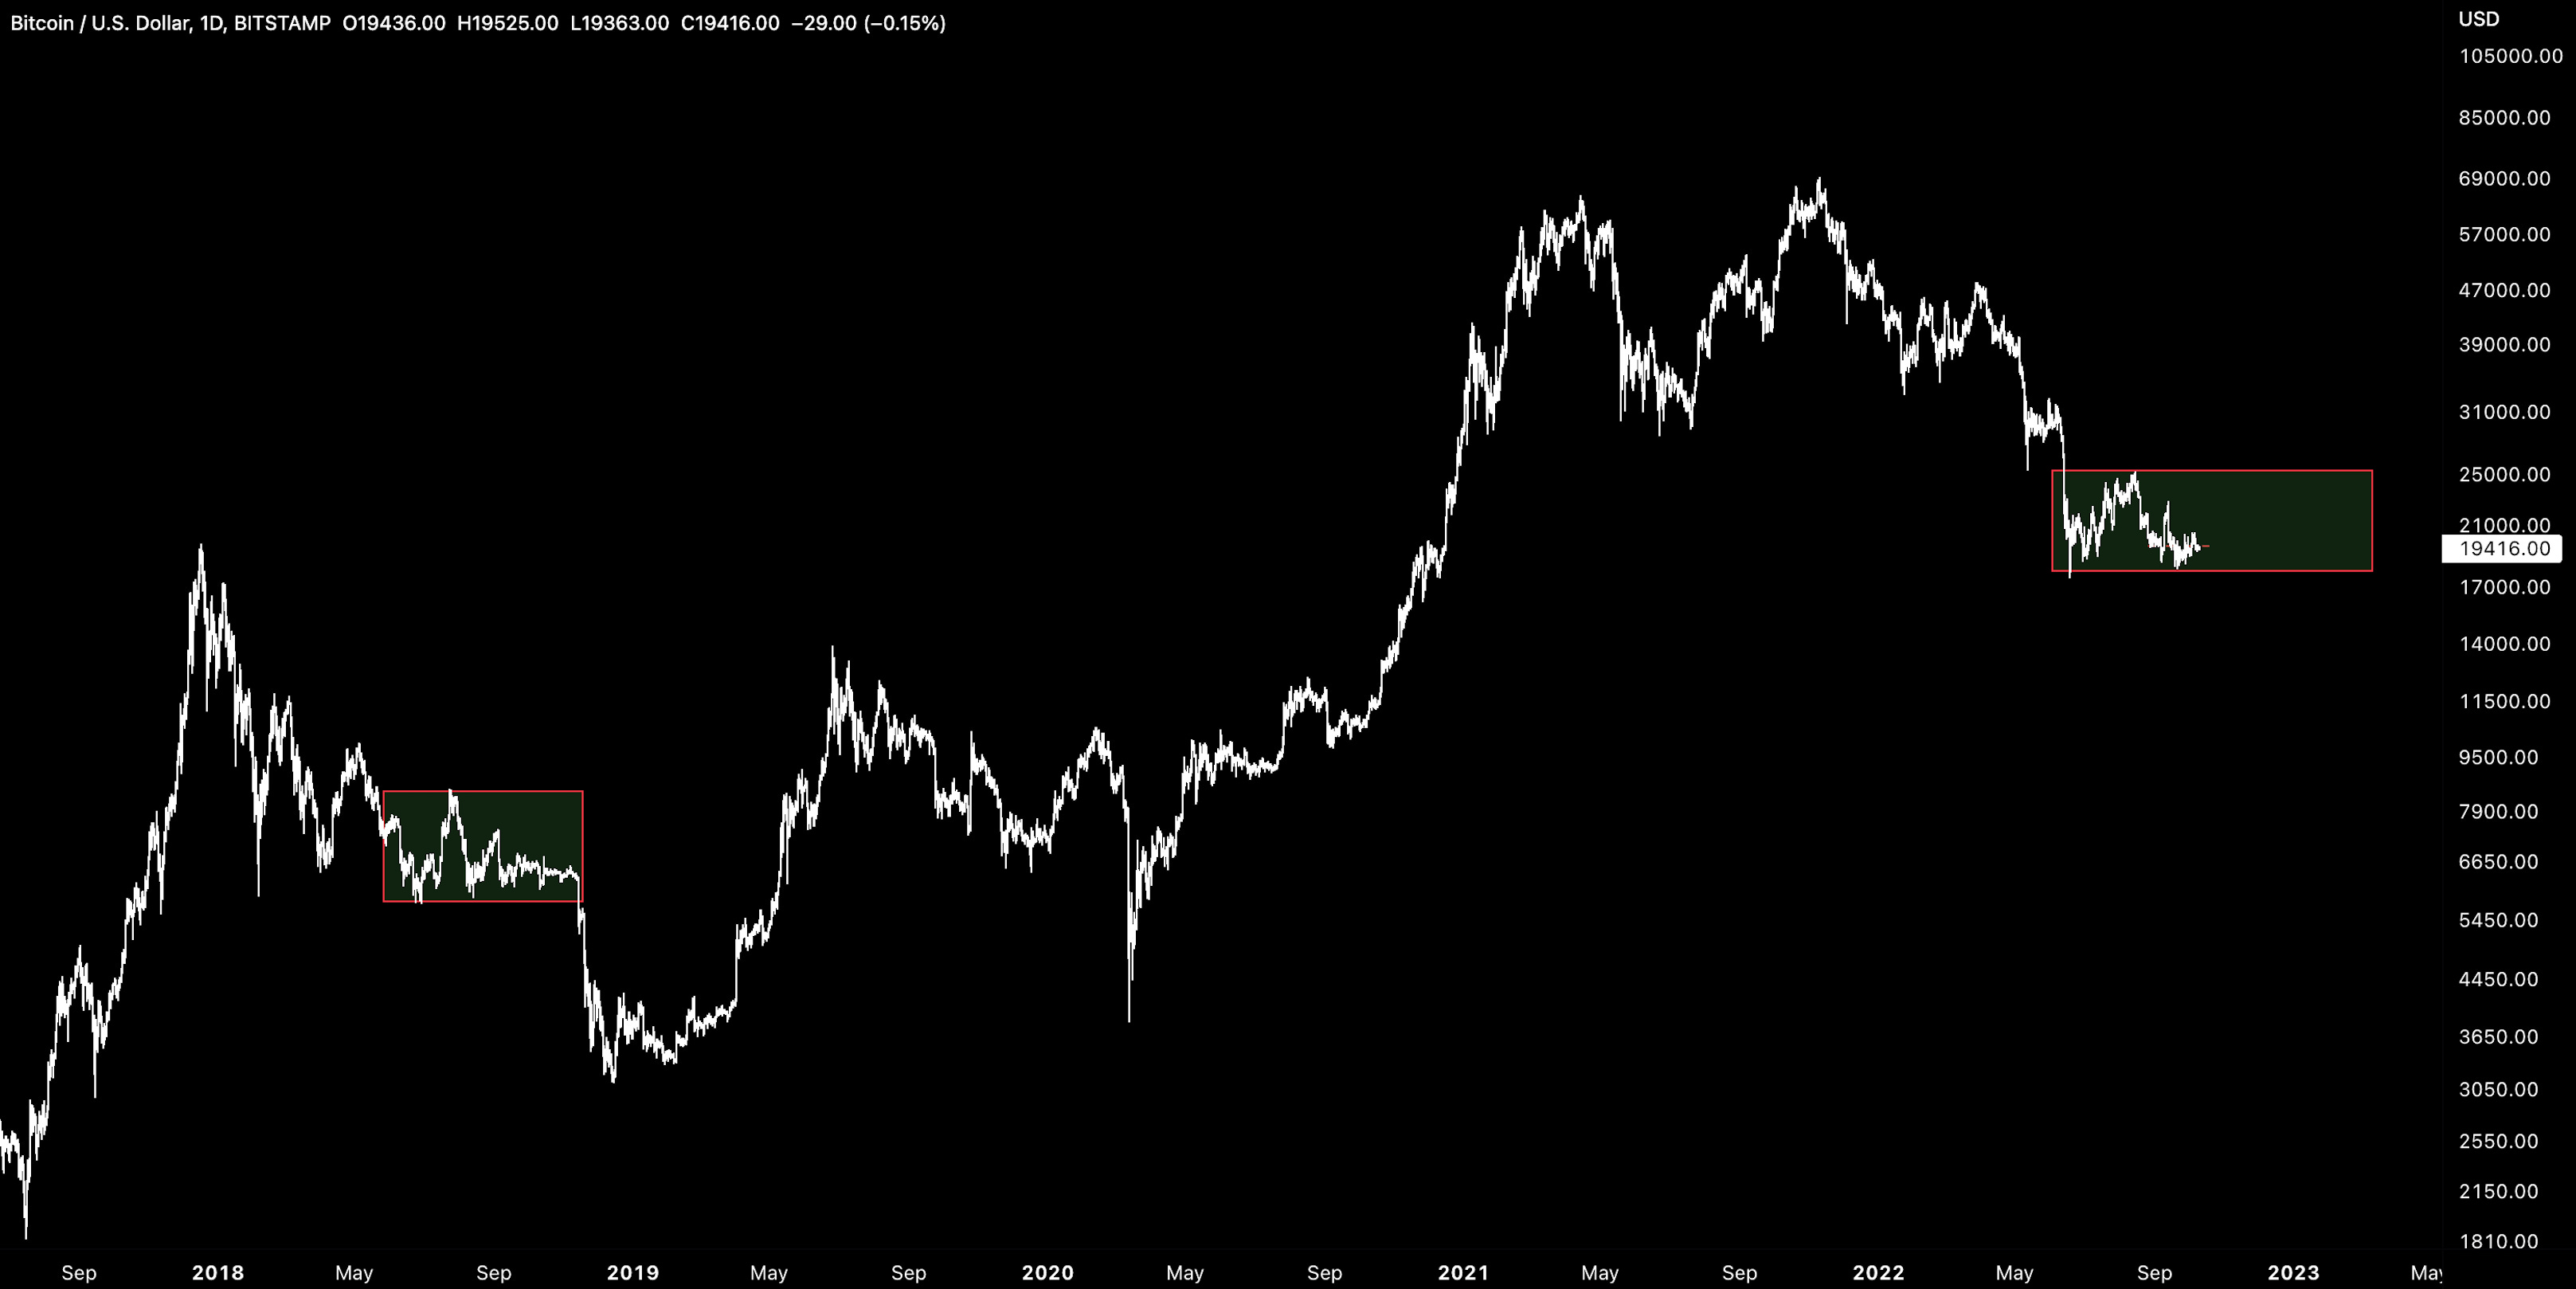
For the bulls, BTC/USD is now looking to break out of its multi-year falling wedge pattern to the upside.

For the bears, BTC/USD has had periods of prolonged consolidation prior to big vol moves to the downside. In 2018, BTC/USD broke its $6k support, falling 48% to form its new local bottom.
History doesn’t repeat but it can often rhyme.
Bitcoin vol indices also point to a material move in the orange coin near-term.
BITMEX’s BVOL has reached new lows not seen since June 2020. Every time this index reaches these lows, Bitcoin has either move significantly higher or lower. This includes the 2018 drop set up.

So which is it? Higher or lower?
For the higher camp, we would need to start seeing early signs of more constructive market buying but we have yet to see it. And you don’t have to look far for the signal.
SOPR is failing to keep above 1 indicating that short-term holders continue to sell out of their positions on any recent rally.

We also see high-level market metrics indicating lower speculative interest in the spot markets with exchange volume returning back to its trend line once again.

For the lower camp, we still have the deteriorating macro picture. That said, as we see above, Bitcoin is holding up relatively well against tech stocks.
However, that relationship can evaporate quicker than you can say “apocalypse”.
In turn, that relationship can also come back quicker than you can say “pivot”.

The skew remains to the downside.
It feels like the market is waiting for the next shoe to drop, a fed pivot, or prices to collapse materially. In other words, we are collectively looking for the next leg down as a flush out in order to pave way for a constructive rally higher.
This is where on-chain models can be useful in determining wick floors in distressed markets including miners. For example, Bitcoin production costs places a floor at $16.1k (note this adjusts in real-time).

One catalyst could be the US CPI data report on Thursday this week among several other releases in the hopper.


This brings us to the macro picture.
A Dislocated Market, A Broken Record
Coming back to the markets after a week away and it appears nothing has changed at all.
The North Star - Liquidity measures continue to show tighter conditions are impacting risk assets directly. So long as this continues, risk assets will face material headwinds.

Central bank balance sheets show the same relationship with big tech. The Fed’s QT is making an impact now, dropping by $206B from peak.
Note, crypto and the fed liquidity indicator is also maintaining its positive relationship with some signs of crypto needing to catch up with material drops in the liquidity index.

Dollar is reaching extreme levels despite central banks like the BoE now stepping in to stabilise the bond market and levered pension funds.
The initial reaction to GBP was positive fiscal spending and (unlimited) limited bond buying is still structurally short on the currency.

Why is this important? The UK development was showing how fiscal policy was fighting monetary policy. The BoE is now forecast to raise rates by 1% with rates hitting 5.75% by next June. This may encourage the Fed to keep their hawkish stance.
However, it’s not just the UK seeing bond yields edge higher. Worsening inflation data (Germany +10% YoY, Netherlands +17% YoY) in Europe from higher energy costs is fuelling this dynamic.
Surging bond yields is only likely to mean any ‘temporary’ bond buying programs by central banks are likely to be extended for the foreseeable. This begs the question of whether the Fed may look to step in and stabilize their own bond market.

In the US, a strong dollar is directionally supportive for capping prices (imports deflation). This poses a problem for US bonds which are offloaded by foreign central banks as part of a counter-cyclical currency management strategy. More importantly, it may also cap how high the Fed can raise rates.


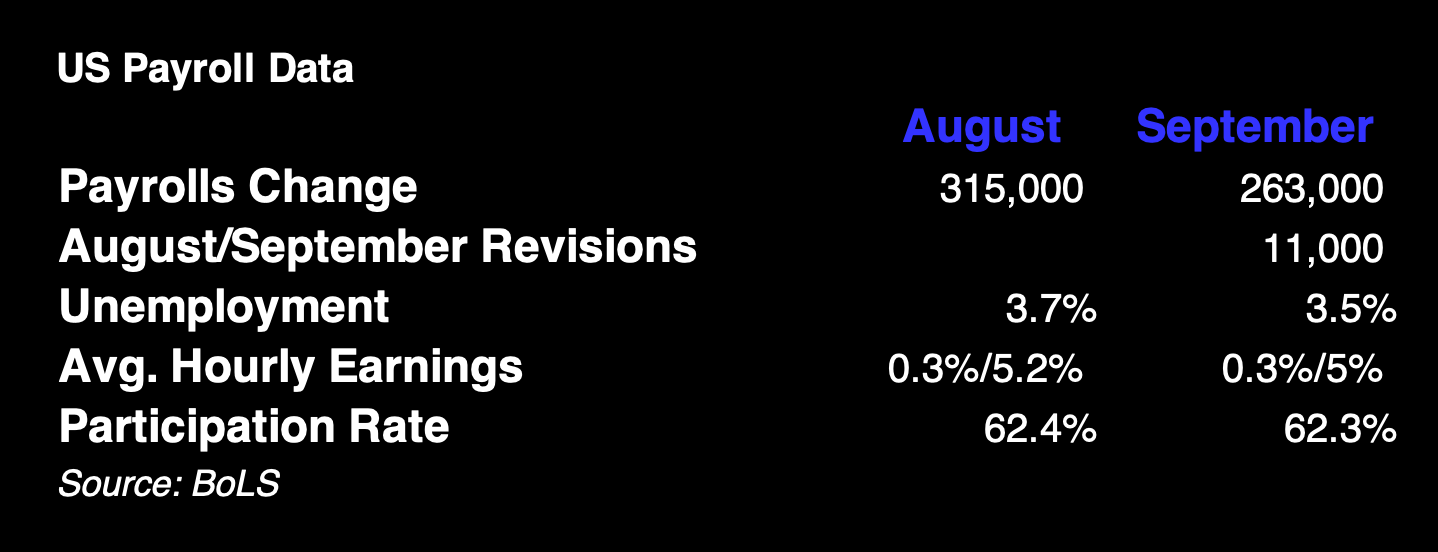
However, it’s a strong labor market and wage market that is applying the pressure across the pond.
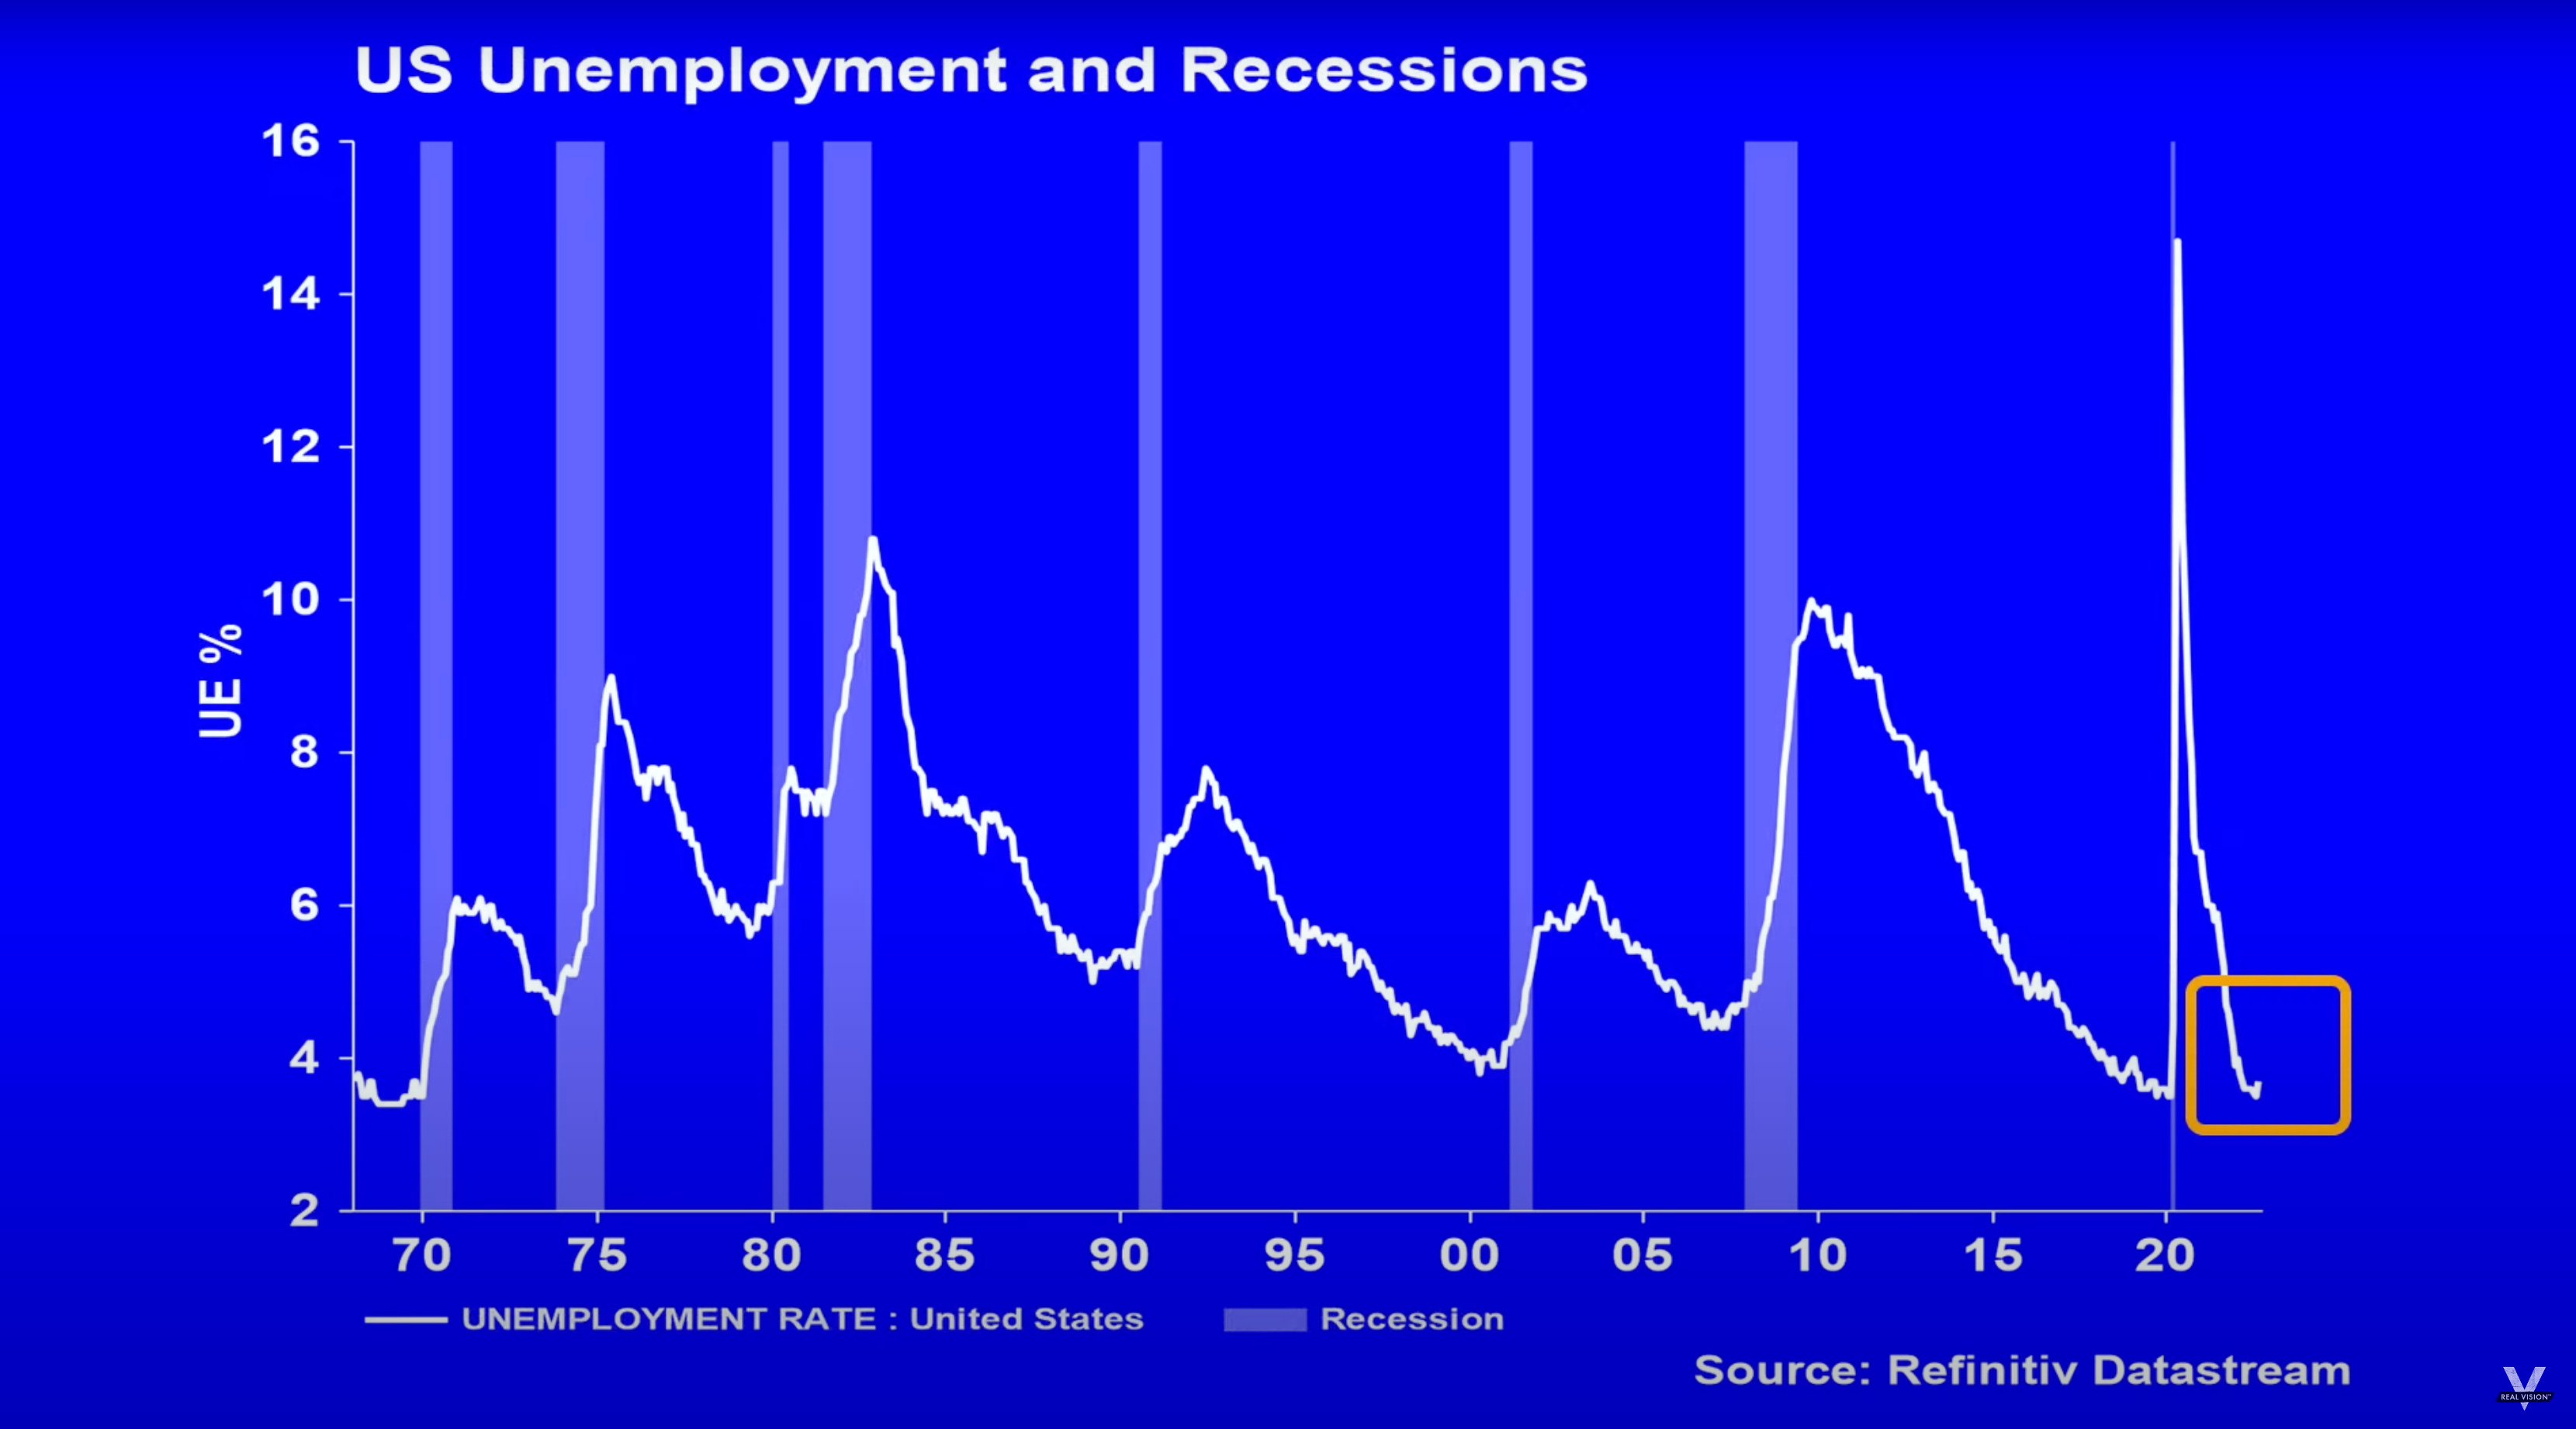
US employment data fails to show enough of a weakening to raise hopes of a Fed pause, limiting equity rallies recently.
Forward P/E is still above prior bear-market lows with a 23 EPS implying a 3,00-3,200 areas to watch for a low (~11-15% drawdown from current levels).

Historically, inflation has only meaningfully compressed during and after a recession. Recessions themselves have coincided with higher levels of unemployment. We have yet to see the latter play out meaning performance in the equity markets is severely capped.
Prices in the US also remain sticky and on the rise thanks to a strong labor market. Annual (and monthly) core CPI which has often moved markets in 2022 is expected to move higher in September, accelerating to 6.5% from 6.3%.
A market rally in anticipation of a pivot only increases the chance of the Fed not needing to pivot.
This may mean the lows will be a 2023 affair with job losses and recessions have defined historical market lows.
So where does this leave us?
Risk assets may see high volatility in the very near-term with the skew remaining to the downside. The equity bottom has likely not yet been firmed up with both liquidity and employment being key data points for investors looking ahead.
As has been the case for several months now, much more work needs to be done by central banks in order to cap prices.
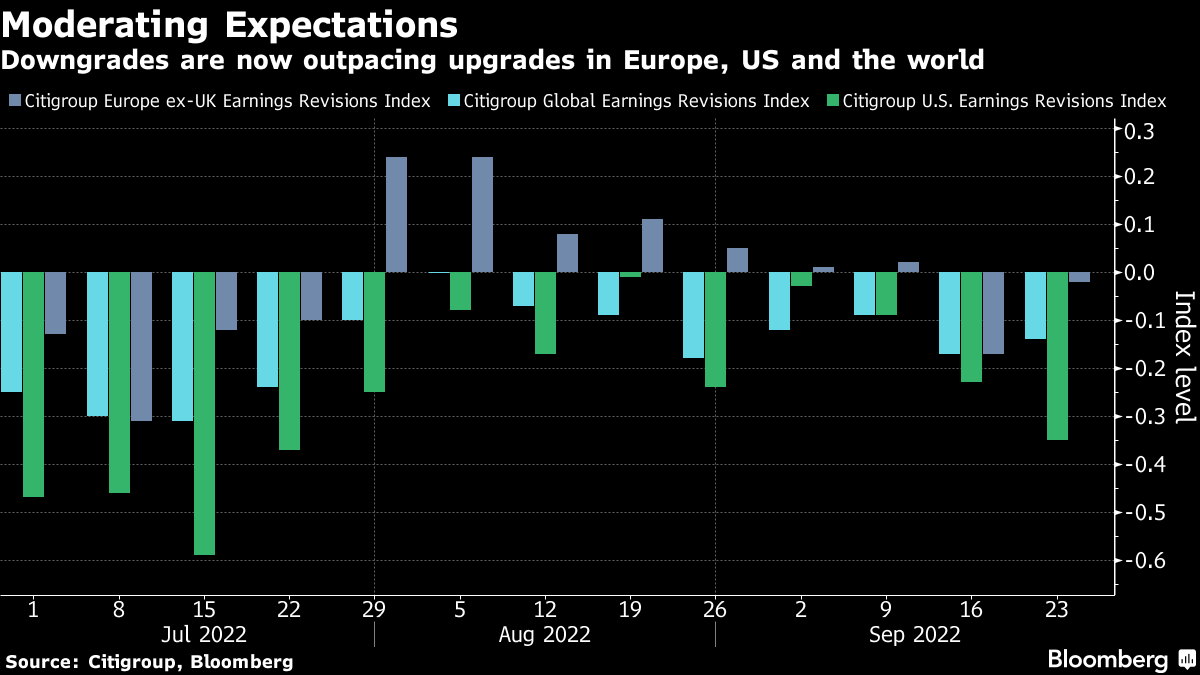
This week will see a plethora of macro data releases that will only likely accelerate the current narrative of lower risk assets, lower earnings, and higher prices.
For crypto, relative performance to tech stocks will be under pressure with any seismic moves to the downside potentially breaking that pattern until a more structured recovery gets underway.
Until something domestically breaks within the US financial markets, we are driving on the same road with the same old tune on repeat.
Decentral Park Market Pulse

Want real time updates and analysis on the digital asset market? Join Decentral Park’s Market Pulse group by clicking the link below:

Top performers over the past week are largely speculative/headline driven:
Top 100 (7d %):
ENS (+23.6%)
Huobi (+23.1%)
Maker (+21.1%)
Evmos (+16.2%)
XRP (+14.8%)
DeFi Top 100 MCAPs (7d %):
Nest Protocol (+48.2%)
Sushi (+31.7%)
xSushi (+29.7%)
Dopex (+23.4%)
Maker (+21.1%)
Frax announced frxETH, a liquid staking solution for Ethereum. The token is expected to be pegged to Ethereum unlike stETH which is a rebasing asset. More details here.
CRV, CVX. FXS are now available as collateral on Fraxlend (along with WBTC and WETH available earlier).
A native cross-chain bridge between BNB Beacon Chain and BNB Smart Chain (BEP20 or BSC) was exploited and 2 million BNB was withdrawn. Users' funds are not at risk, no action required.
Lido is allocating 150,000 LDO tokens in rewards per month from Oct 7 for wstETH across Optimism and Arbitrum. Protocols include Balancer, Velodrome, Curve, Kyber etc.
Global Market Cap

$898B; Global market cap increased by 2.3% last week but firmly remains within channel. Recent oscillation has been around $900B.
DeFi MCAP

$42.2B; DeFi market cap increased slightly by 3% last week. Still kept range bound between $43B and $60B.
Bitcoin Dominance

Bitcoin dominance flat last week. So far the ratio has struggled to break above 42%. Every bounce from its local lows (off support), the ratio has entered a prolonged period of relative strength.
Trader Positioning
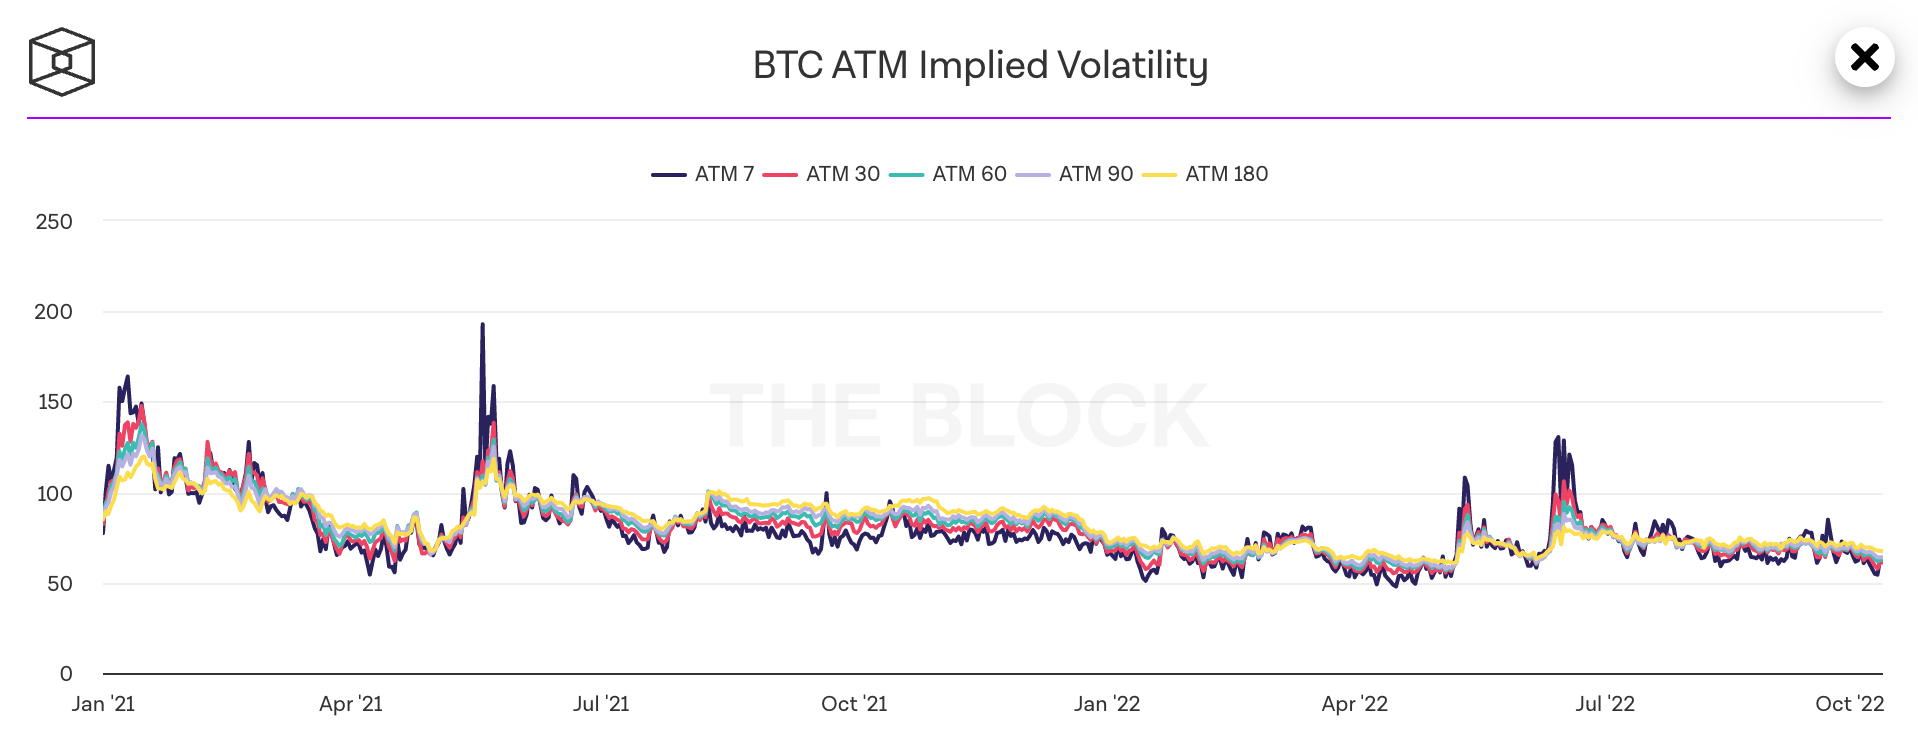
IV shows premium to RV at the short end. Longer-dates are being dragged down. BTC 1M ATM implieds falling from ~64 to ~57. 7D now sub 40v. Evidence of stronger put selling on spot lows vs. buying.

Option OI put/call ratio fairly flat for ETH while BTC is seeing higher call interest in recent days.

BTC futures OI (BTC-denom) and OI/MCAP climbing to new highs.

Agg. BTC funding rates mildly positive after having being briefly negative indicating an overall bullish positioning by traders now.

Agg. ETH funding rates remain negative.
Grayscale GBTC
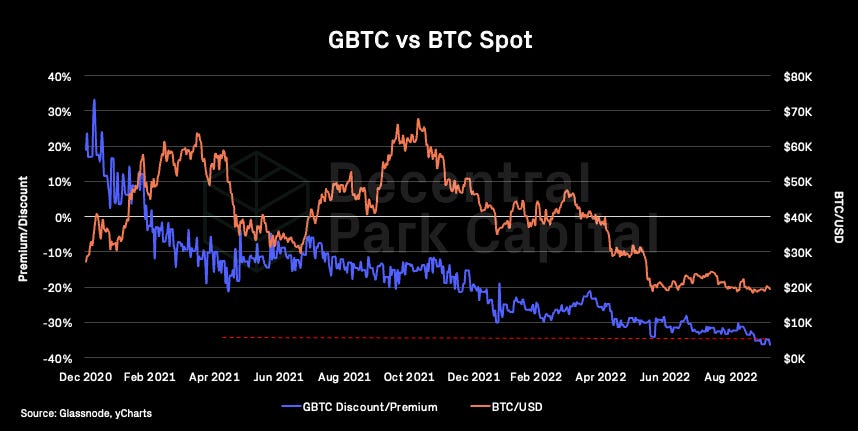
GBTC’s discount to NAV is widening to new ATHs as digital asset investment products saw outflows totalling $5m last week. Note, Bitcoin saw 4th consecutive week of inflows totalling $12m.
Grayscale ETHE

ETHE’s discount to NAV is also widening and confirming descending channel in premium. ETHE discount has suffered post merge but interest has been waning for a longer period. ETHE volumes have now declined 50% since July.
Volumes

Daily exchange volumes have plummeted over the past week, reaching closer to its low trend line once again ($18B). Possible sign of muted retail interest.
Aggregate Order Books

Order books looks fairly even. Heavier resistance up to $19.9k.
Bitcoin Hashrate

Bitcoin hash rate has surged to new ATHs of 248.6 EH/s (7d MA). Higher resource commitment by miners has led difficulty to adjust to the highest level ever printed since May 2021 (+13%).
Hashprice now at $80/PH/day range, such a significant increase in difficulty will drop miner revenue by ~10% leading to potentially more distressed situations for mining companies which are already down 70%+ YTD.
📚 Circle’s USDC Losing Market Dominance [CoinDesk]
📚 What Lurks Below The Surface Is A Reason For Concern [Zero Hedge]
📚 An Ethereum team has warped Uniswap onto StarkNet [The Block]
📚 Thoughts on the Binance Hack [Ethan Buchman]
📚 October 2022 Newsletter: Energy vs Sovereign Bond Markets [Lyn Alden]
🎙️ Sequoia’s Crypto Thesis [Empire]
🎙️ Earnings Season Will Be Very Bad | Weekly Round Up [On The Margin]
🎙️ New Legal Filings Are Ominous for Celsius, Terra, and 3AC [Real Vision Crypto]
🎙️ Why Crypto Legislation Could be Passed By Year’s End [Unchained]
🎙️ Weekly Roundup 10/07/2022 [On The Brink]
The information above does not constitute an offer to sell digital assets or a solicitation of an offer to buy digital assets. None of the information here is a recommendation to invest in any securities.