


Join the 1000’s of founders, investors, crypto funds, brokerage firms, and developers in getting free cutting edge crypto research by subscribing below.
Crypto markets have reversed course in a largely choppy weekend episode. Global market capitalization peak at $1.102T on Friday before falling to the $1T mark this morning.
In our previous edition of The Weekly, we noted that price rallies were likely driven by capital ‘chasing momentum’ after a prolonged period of inertia which seems to have been the case.
Last week, Ethereum largely stole the show leading the broader market with its merge narrative helping lift sentiment around the L1.
Volatility was supported by strengthening spot volume with centralized exchanges seeing closer to $25B. Zooming out, however, and the wider declining trend in volume is clear with lower peaks and lower lows in play YTD.

Short liquidations were a key driver in ETH’s strong performance with over $250m+ positions being rekt during the squeeze.
The market was calling for ‘the merge inflection point’ while de-emphasising the continued macro headwinds at play.
Fast forward to today and the sentiment has reversed once again only for the same ‘merge analysts’ now calling for lower prices.

ETH/BTC faces resistance at 0.07 with momentum indicators signalling a breather for the pair was overdue.

This is also a time when analysts remind us of the current ‘generational bottom’ in on-chain valuation metrics. Values printed by metrics like MVRV are statistically interesting but they don’t factor in the macro inputs directly into its model.
They have only existed during periods of QE and the ‘bottom zones’ are not well defined or tight.

The macro has largely always informed crypto since inception.
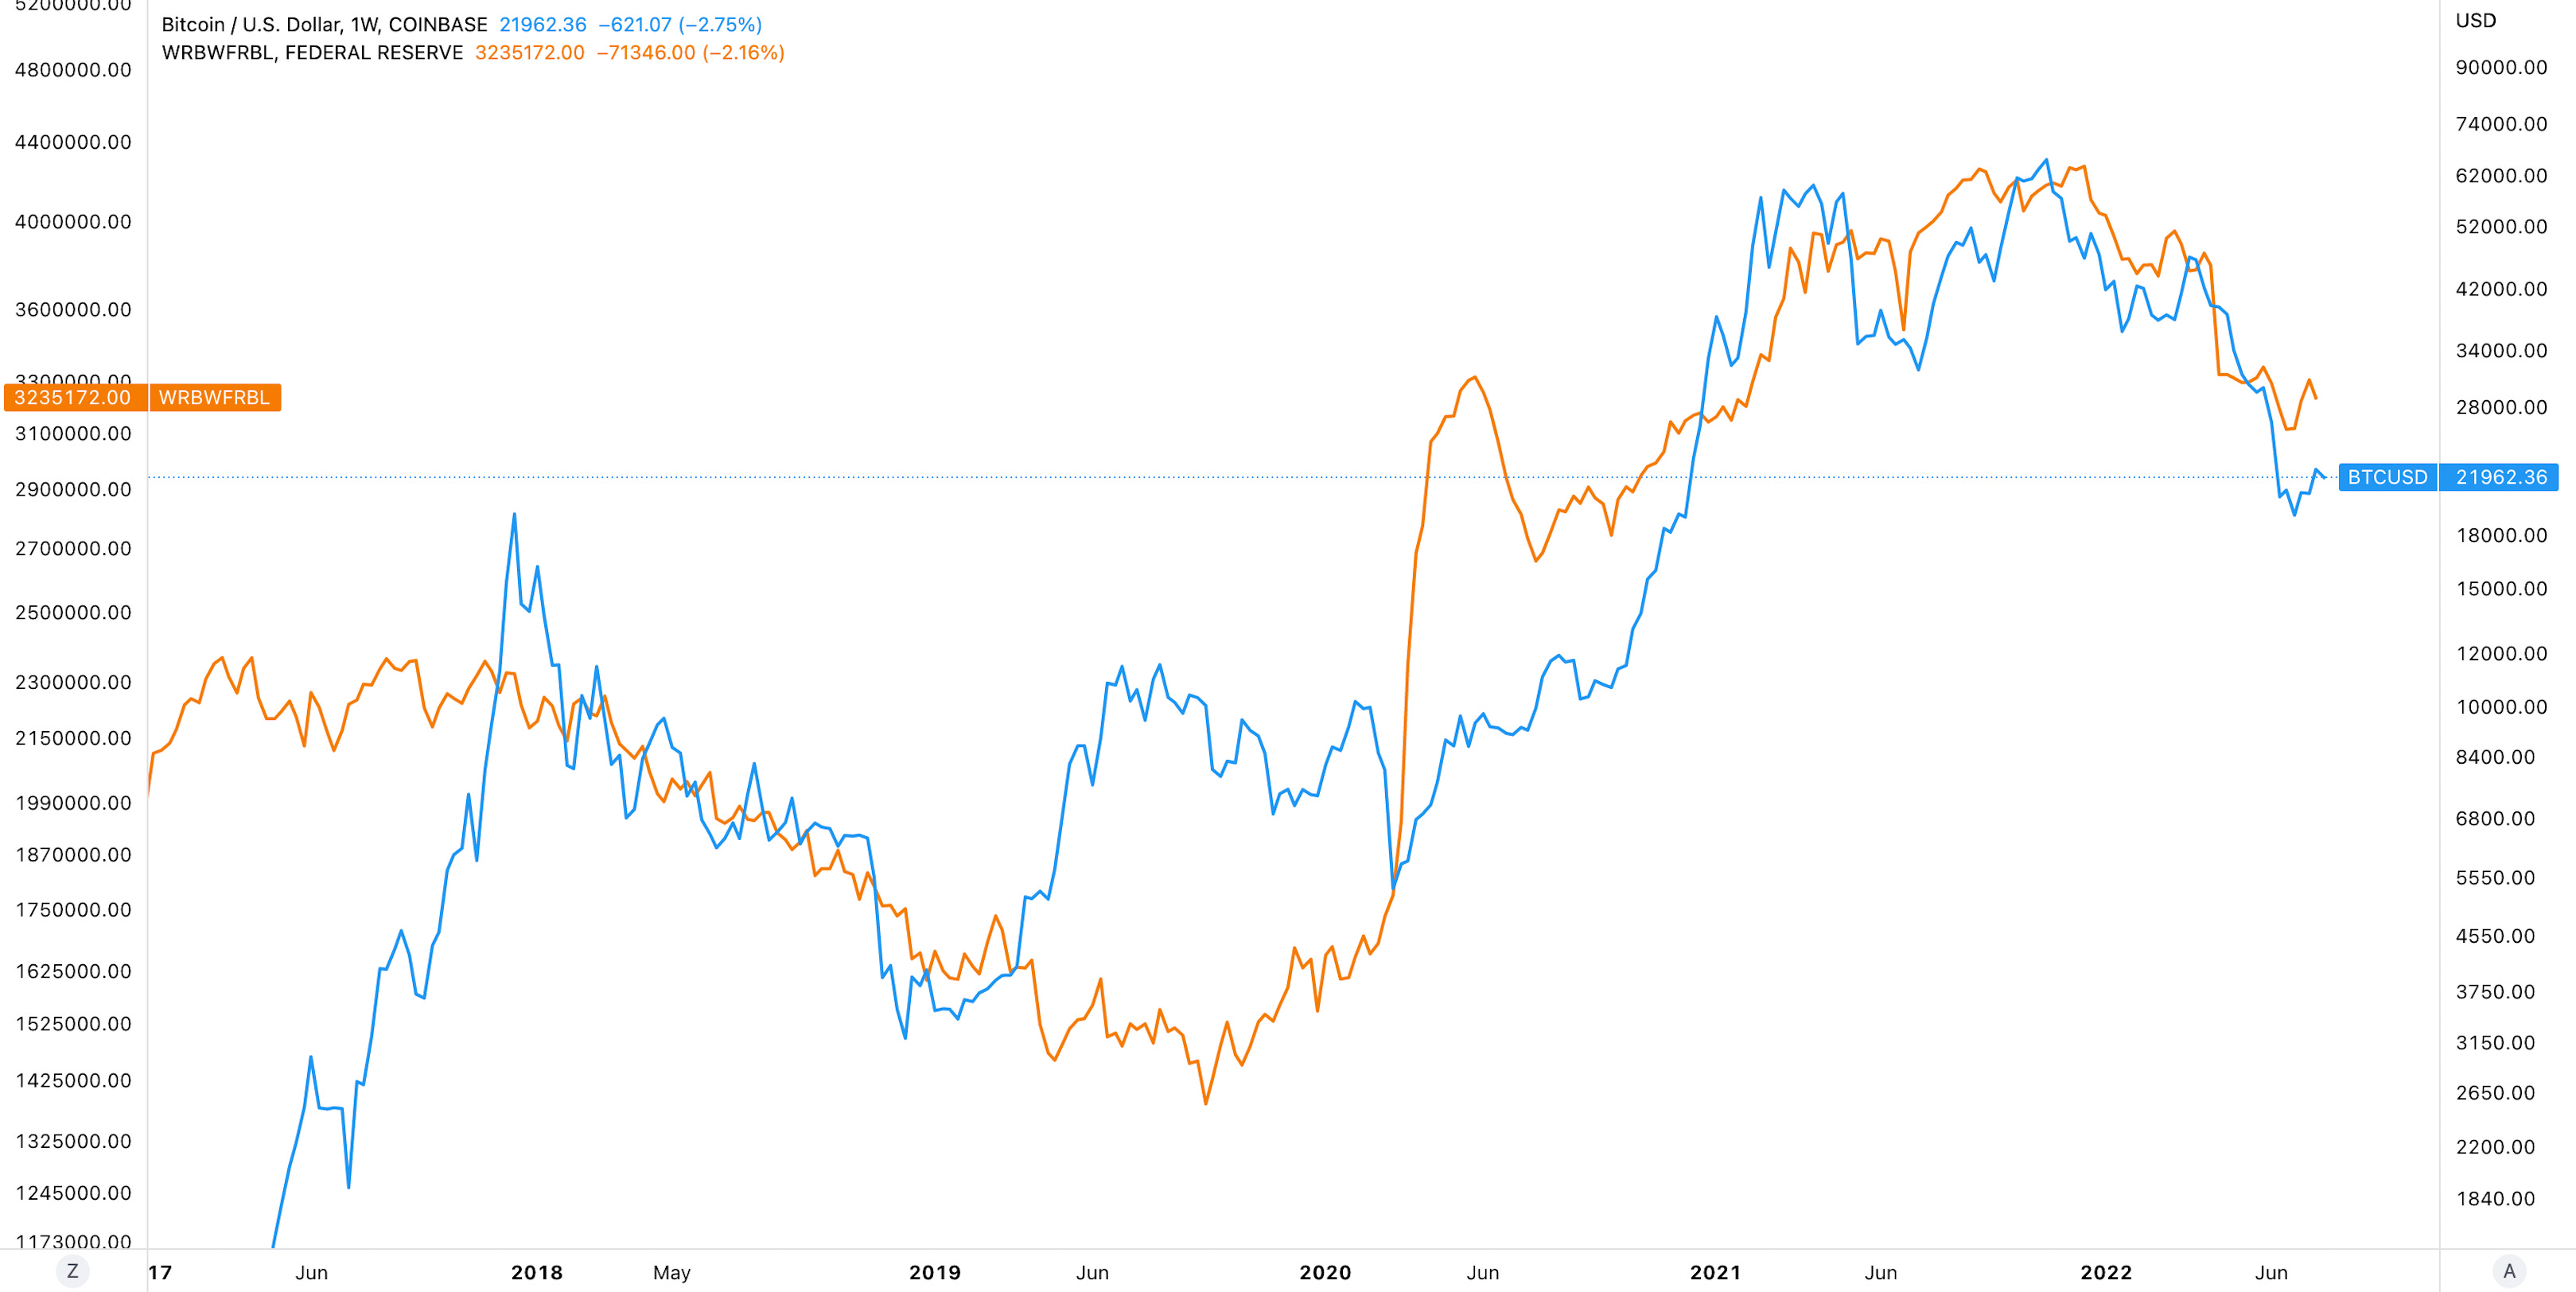
Liquidity expansion in the broader markets has aided crypto since for over 10 years and the correlation is startling. Where liquidity (take Fed balance sheet) measures and Bitcoin de-couple they mean revert back to one another eventually.
Extrapolating this forward, a more destructive path for QT in the US can send BTC/USD lower.
Data like US services PMI still shows deterioration in the US economy and a high risk of recession. The PMI printed is weakest level in two years.
It’s not just the US, though. The rate of change for M2 (monetary supply) is highly correlated to the performance of crypto market cap.

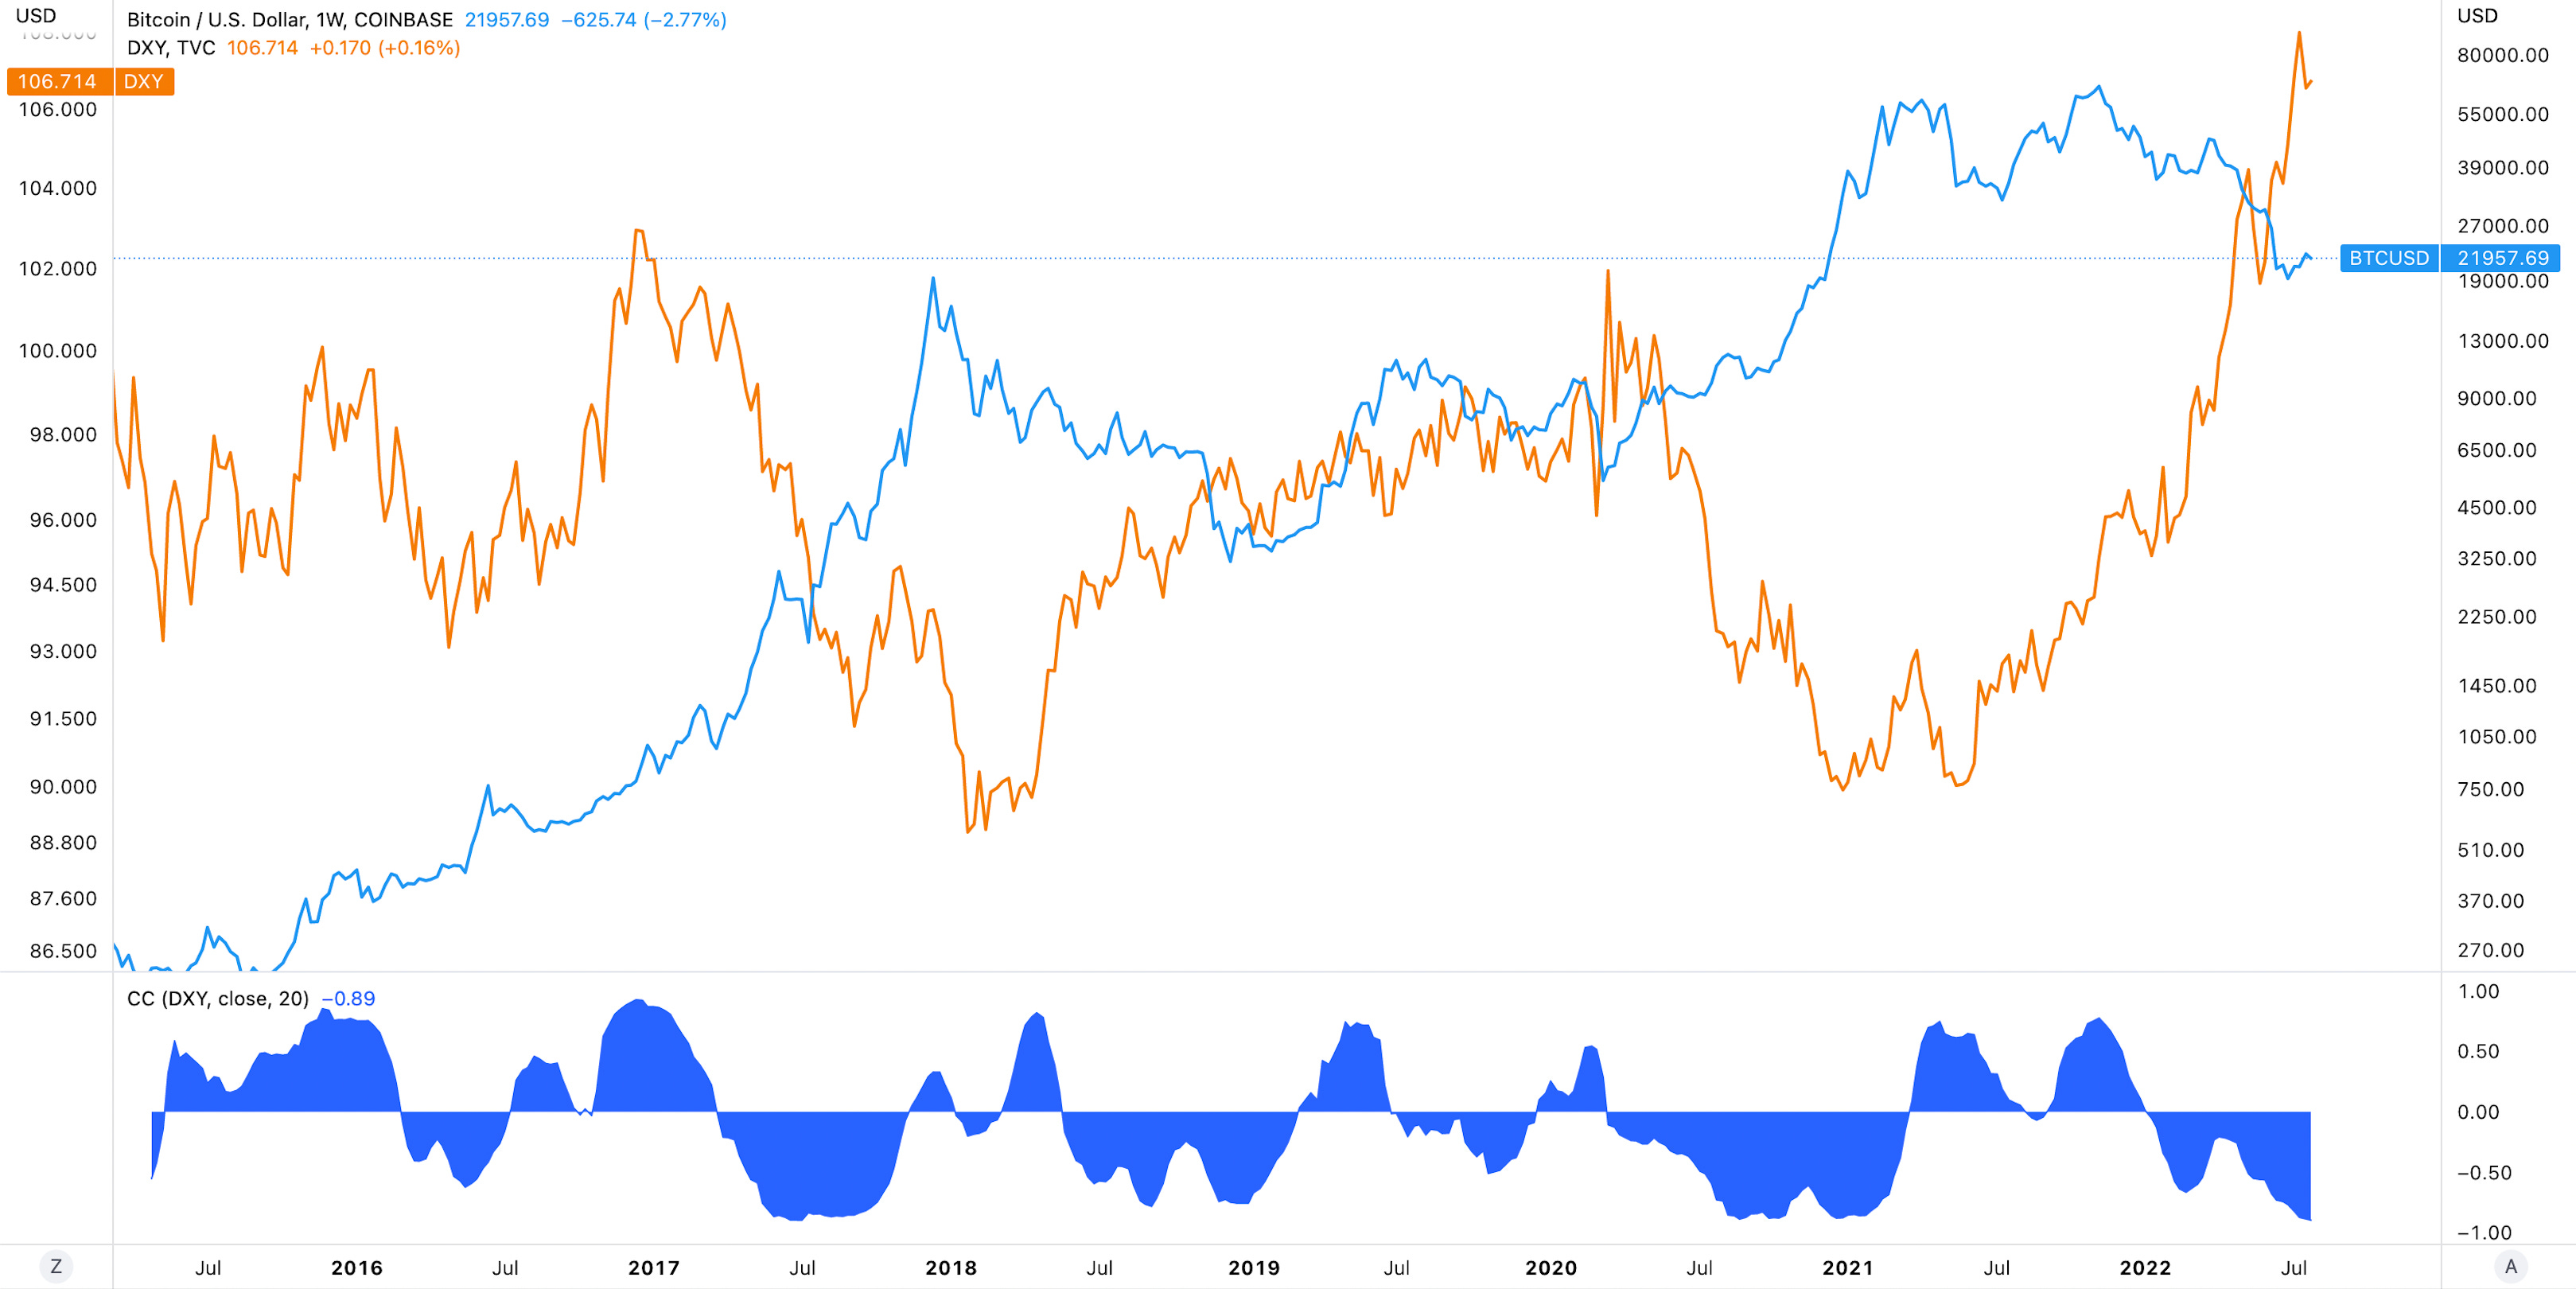
Another framing here is through dollar gauges. Dollar is at a 20-year high with dollar strength having a negative impact across most markets. Businesses with focus on US exports are seeing valuations fall from future earnings adjustments.
The Fed, now expecting to hike rates by 75BPS this week, continues on the path of tight policy to restrain demand. Periods of high rates normally attracts foreign investors which drives strength back to the greenback.
Dollar strength is a clear headwind for crypto where most pairs are denominated in. Simple correlation analysis shows as the value of the denominator goes up, value of the numerator goes down.
In sum, paying attention to Fed’s policy (whether QT or rate hike decisions) or broader global monetary expansion can be more of a north start than these macro blind on-chain metrics.
More specifically, understanding future currency debasement and liquidity dynamics are the predominant drivers for forecasting price moves.
With bond yields now falling the market may be signalling a Fed pivot may come sooner than previously thought. On the flip-side, the European Central Banks raised rates for the first time in 11 years stating high rates will remain until 2% inflation is met.
On-chain valuation models do have their role to play be helpful especially through the lens of Metcalfe’s law. Last week’s move saw a corresponding jump in on-chain activity but falling once again.
Key inputs such as active network participants and transaction value are again also tied to the macro. Periods of slow growth and recessions will do little to boost on-chain activity if a growing number of individuals don’t have the speculative dry powder to participate.

A number of indicators already signal this dynamic. Aggregate ETH-denominated layer 2 TVL has fallen from 3.8m to 2.85 since mid-June as market participants exit back to the L1.
Even if these market participants moves back to safety, the velocity of stablecoins have fallen since 2021 with volume falling as a ratio of total supply.

Finally, DeFi faces a long battle against beta. The more speculative sector has bled out against the market since October 2021, trading within a descending channel.
Overlay the Fed balance sheet and we can see this bearish DeFi/beta trend coincides with the tightening of liquidity conditions.

Crypto is a long duration asset driven by the macro factors mentioned above - liquidity and money supply. What’s compelling at this point in time is that we are heading to a macro cycle inflection point - the rate of change in M2 is now turning.
While there is some evidence of conditions in the US being too tight for its own good, it is another question as to what policy the Fed (which has been known to lag) actually does in response to new economic data. Only time will tell.
For now at least, demand destruction within crypto appears to be in full swing and as a long duration asset it may also be the first one to turn when it’s perceived that central banks are reversing course once more.

Top performing assets have often been event-driven including Aave’s release of GHO stablecoin and Messari’s release of the State of Uniswap Q2 2022.
Top 100 (7d %):
Quant (+38.5%)
Aave (+33.3%)
Internet Computer (+27.7%)
Uniswap (+25.8%)
Polygon (+20.8%)
DeFi Top 100 MCAPs (7d %):
Convex Finance (+41.6%)
GMX (+36.2%)
Aave (+33.3%)
Neutrino System Base (+28.2%)
Global Market Cap

$1.02T; Global market cap has lost 3% over the past week.
DeFi MCAP And Dominance

$44.5B; DeFi market cap has increased by 1% over the past week while DeFi dominance has stayed flat over the same period.
Bitcoin Dominance

Bitcoin dominance fell from ETH strength finding support at 42.4%. Continued de-risking in markets could see a 44%-47% dominance over the coming months.
BTC/USD and ETH/USD

ETH/BTC
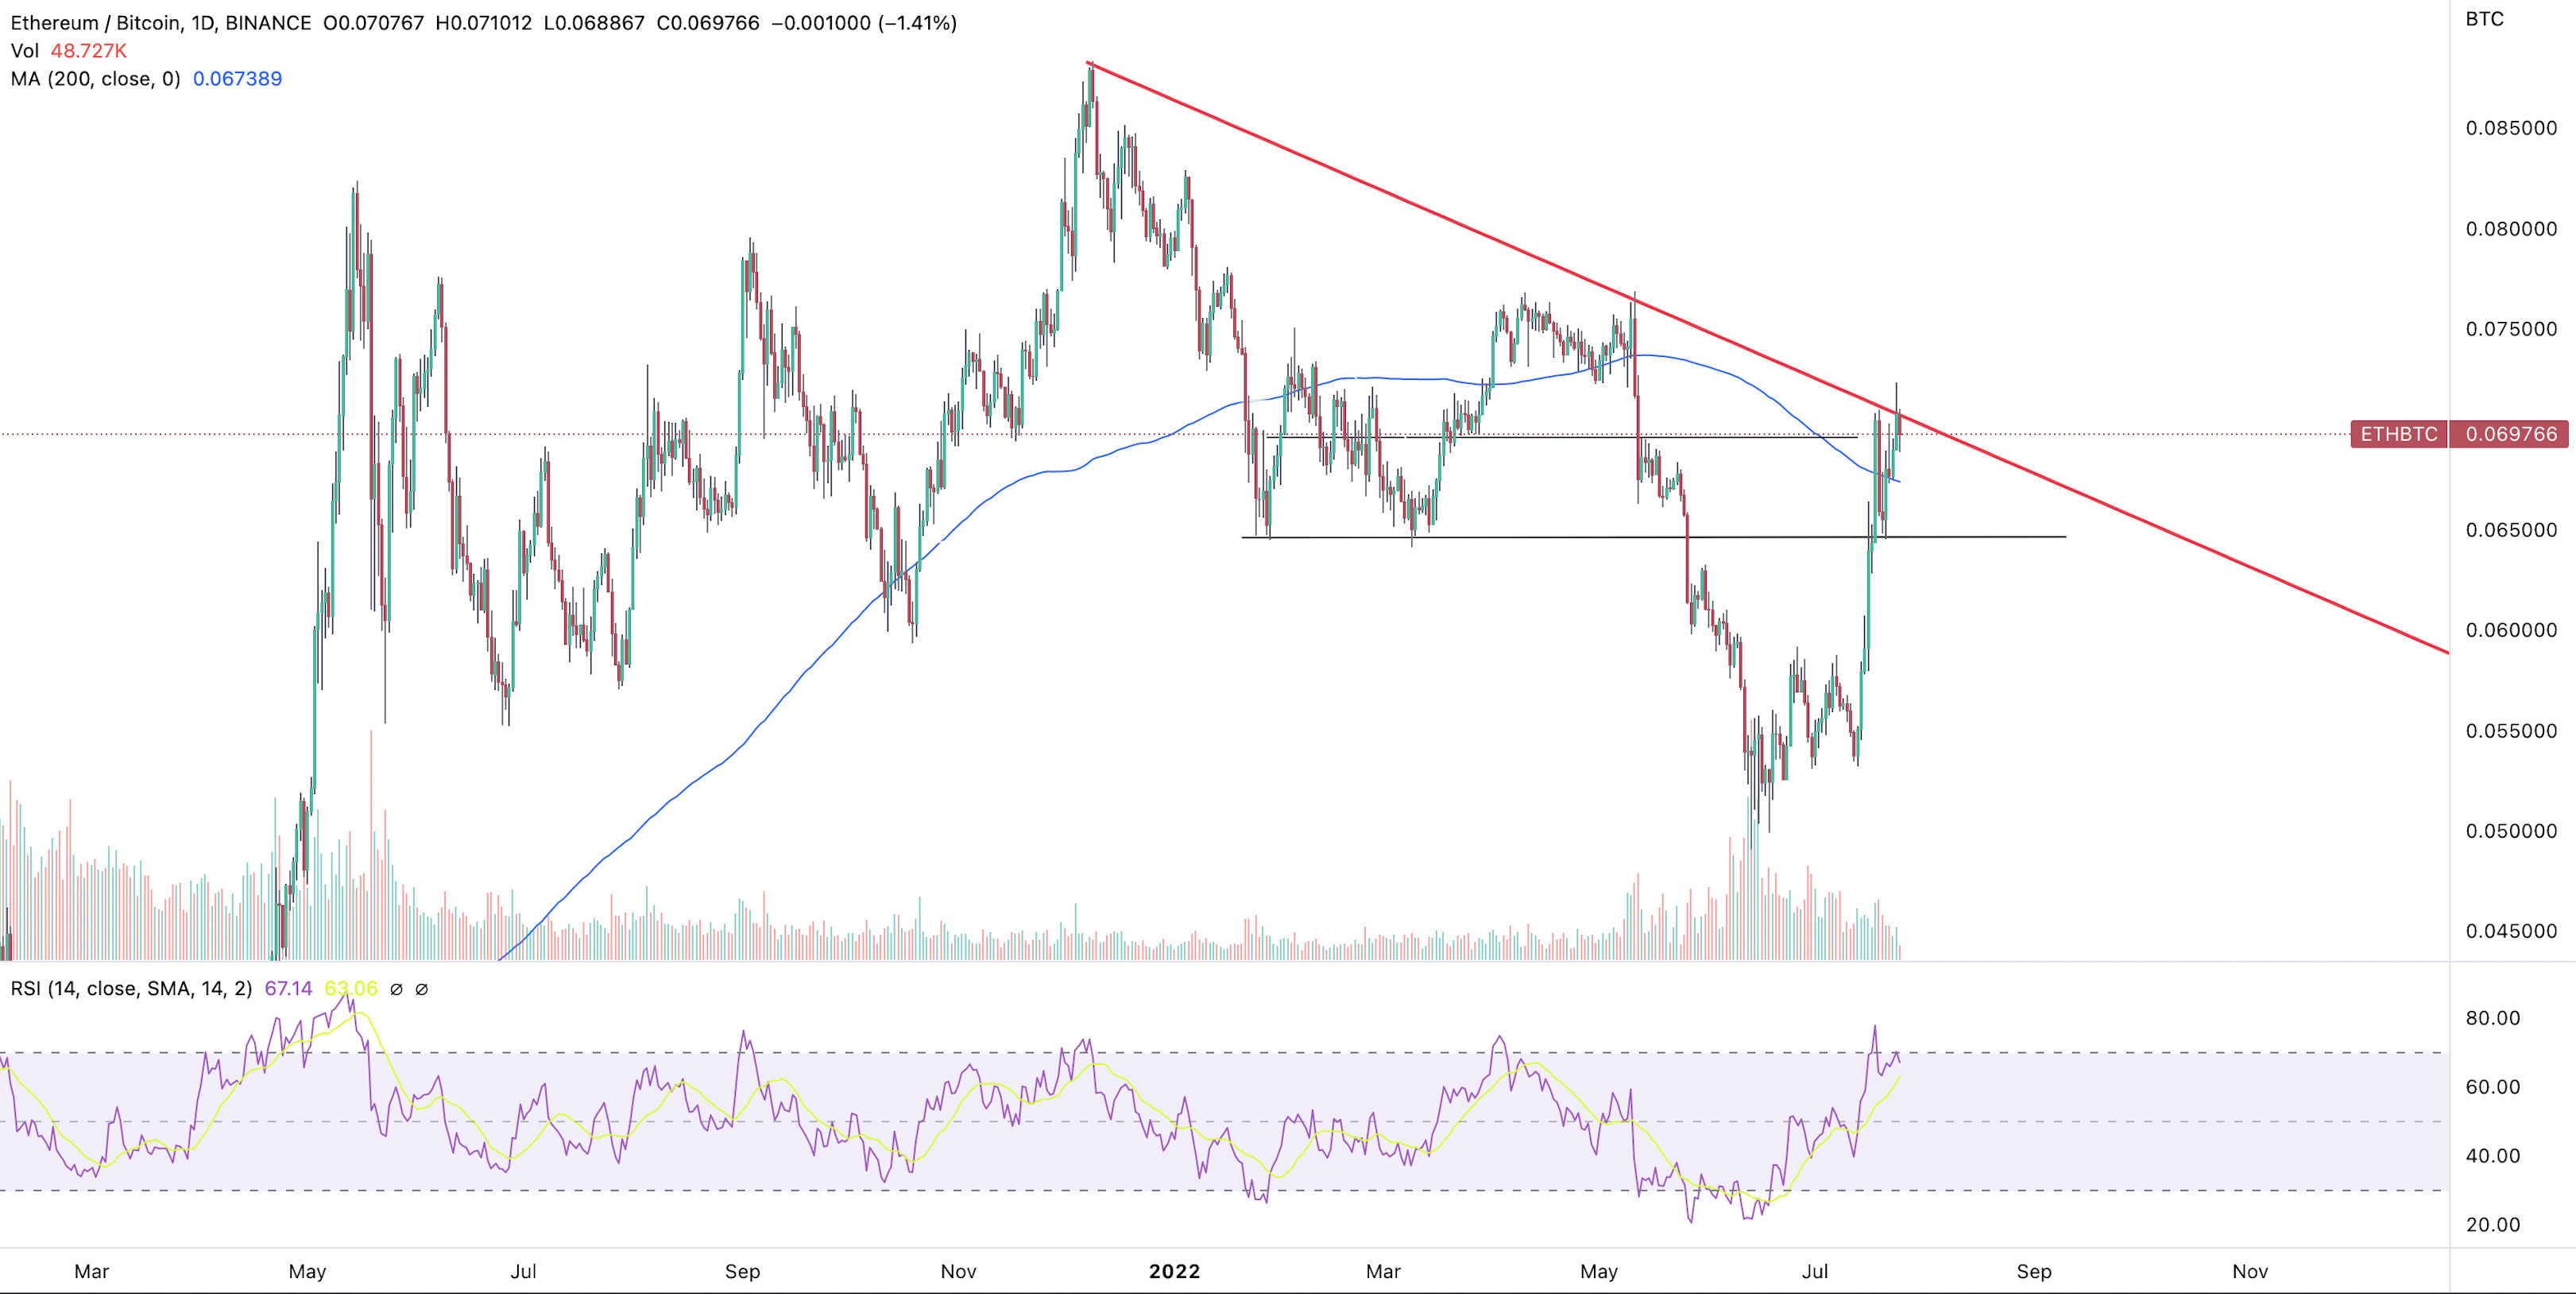
ETH failed to break a new local high with daily RSI indicating a potential cooling off on its BTC ratio.
Global Market Cap
$1.02T; Global market cap has lost 3% over the past week.
DeFi MCAP And Dominance
$44.5B; DeFi market cap has increased by 1% over the past week while DeFi dominance has stayed flat over the same period.
Bitcoin Dominance
Bitcoin dominance fell from ETH strength finding support at 42.4%. Continued de-risking in markets could see a 44%-47% dominance over the coming months.
BTC/USD and ETH/USD
ETH/BTC
ETH failed to break a new local high with daily RSI indicating a potential cooling off on its BTC ratio. ETH/BTC facing resistance at lower peaks while ratio pump coincided with falling spot volume. Possible strength set up in BTC/ETH over coming week.
Volatility

BTC & ETH; Falling realized vol for both BTC and ETH as price consolidate. Possible uptick in vol around FOMC later this week. BTC ATM 1m 75.5% AND 3M 75%.
Trader Positioning


Moderate positive funding rates for both BTC and ETH indicating traders taking a predominantly bullish stance. Bitcoin Futures OI/MCAP rising to new ATHs of 0.0165 as speculation increases relative to underlying market cap growth. Put/call ratio decline slightly from previous week.
Combined Order Books
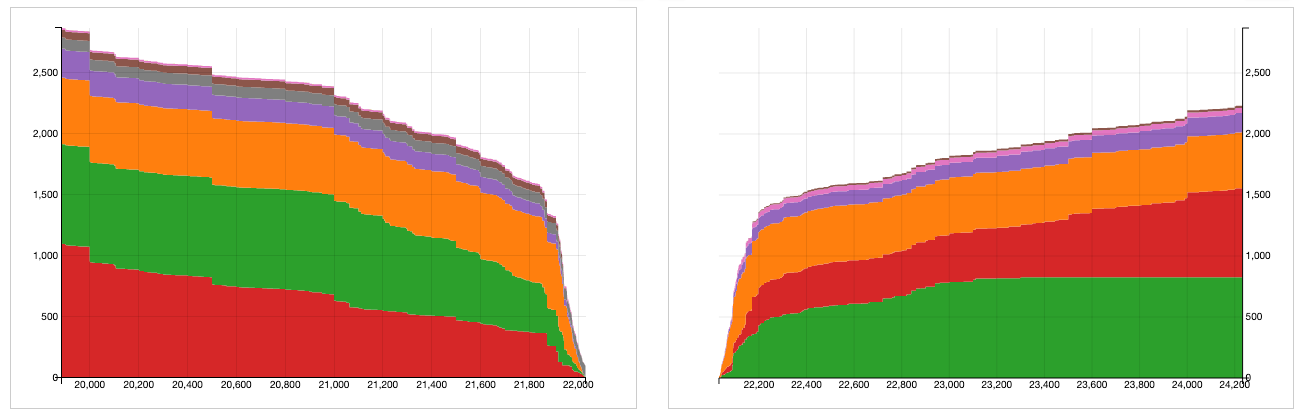
Order books look slightly heavier on the bid side. Heavier resistance up to ~$22.3k.
Macro Correlations

Crypto vs. Equities vs. Gold vs DXY; Cryptoasset correlations with broader risk markets kept high (~0.8). Vol from FOMC (if any) within the equity markets likely to carry over to crypto this week.
Trusts

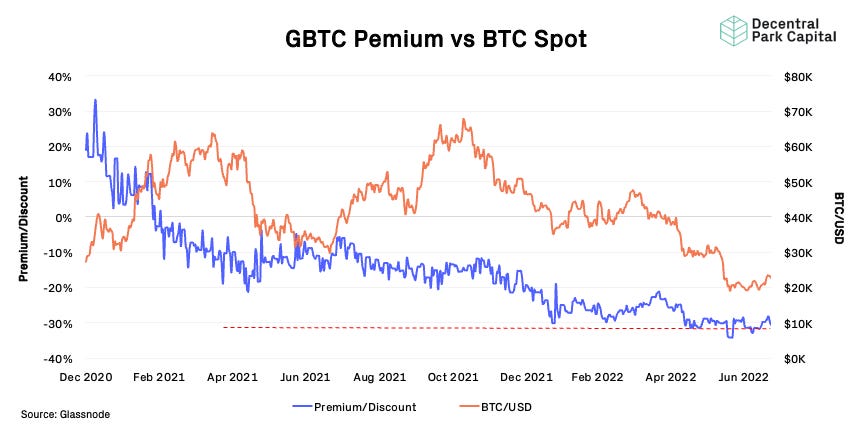
GBTC; GBTC discount still persisting (~30%) and moving closer to ATH. GBTC volumes have been flat over the past week (7.4M).
Grayscale ETHE

ETHE; ETHE discount narrowed to 23% as the merge narrative boosted sentiment for the cryptoasset. Early signs of the discount widening once again with the premium dynamic likely to be driven by broader spot action. ETHE. ETHE volumes increasingly slightly over the past week.
Mempool Size

No notable increase in mempool size meaning demand for block space is relatively low.
Bitcoin Mining


Bitcoin hashrate continuing on its downtrend for now as network difficulty falls in response to reduced hash commitment. Mining profitability remains low at $0.07 per say per 1 terahash per second (THash/s) - the lowest levels since October 2020. Falling hashpower has meant Bitcoin hash ribbons has yet to signal miner capitulation is complete.
Volumes


On-chain real (BTC) & off-chain volume; On-chain volume has fallen 28% while off-chain volume is up 36% over the week (divergence).
Exchange Flows

Exchange Net Position Change for Bitcoin has nearly flipped from strong net outflows to net inflows. While this can be a poor predictive tool for future price action, it is interesting to note that times where flows flipped negative to positive have often marked the start of swings in price dynamics. Today, it is unclear if the indicator flips positive and what volumes exchanges would see.
ETHCC

Missed out on EthCC? You can find all of the EthCC [5] 2022 presentations here.
📚 Protocols As Minimally Extractive Coordinators [0xZuberg]
📚 New A16z Newsletter [A16z]
📚 Institutional Loans in Crypto [iWitty]
📚 MakerDAO And Real World Assets [Ally Zach]
📚 Mapping Out NFTs <> DeFi [sal-coin]
🎙️ What the Fed's Balance Sheet Unwind Means for Markets [Odd Lots]
🎙️ Wormhole and ZK Rollups [The FTX Podcast]
🎙️ What Went Wrong? [Making Sense]
🎙️ On Inflation, Recession, and Reimagining The Economy [The Breakdown]
🎙️ Let King Dollar Be your Guide [Real Vision]
The information above does not constitute an offer to sell digital assets or a solicitation of an offer to buy digital assets. None of the information here is a recommendation to invest in any securities.