


The Weekly #234
All eyes are on the Fed rate hike this week but the debt ceiling will be the only thing that matters for the cryptoasset market.


Join the 1000’s founders, investors, crypto funds, brokerage firms, and developers in getting free cutting-edge crypto research by subscribing below:
Teetering on the Edge (Round 2?)
The cryptoasset market fell 2.8% last week in what appears to be a corrective phase back down towards our $1.12% market capitalization support.
After topping out at $30.4k, BTC has now retreated back below $30k to $28.1k. For ETH, the $1.9k mark was broken down with ETH falling to $1.83k.

We still see Bitcoin's relative strength as the key momentum trade to watch out for.
Bitcoin dominance remains elevated at 3-year highs and seems like it wants to break higher. If it does, this will likely mark a new market regime of prolonged Bitcoin outperformance. Let’s see.

BTC breaking cleanly above its electricity cost (where it trades today) may also be bullish for the asset’s market dominance beyond just price as we see for the mid-2019 and the end of 2020 setups…

ETH/BTC has been rounding down since the Autumn of 2022 and pushed the ratio back to its 128w MA where it may be used as good support.

On-chain usage for the Bitcoin network has spiked with the transaction count soaring to 446k+ at the end of April which is backing Bitcoin’s relative strength too.

BTC climbing above $30k may be a partial driver but we see activity around Ordinals as being the main catalyst.
Ordinal inscriptions made new highs throughout April with 23 BTC (250 BTC ITD) in feed being paid to miners for inscriptions.

Bitcoin vol indices remain at relatively low levels that have often coincided with spikes in volatility shortly after too.

For alternative blockchain ecosystems, we see divergences in usage with networks like Solana picking up slightly in the month of April while NEAR active user sets have made new lows since September 2022.

Still, Alt L1s face an uphill battle in their ability to outperform BTC including those with relatively higher network usage vs. competitors.
The 200d MA has been the ceiling for SOL/BTC since February 2022 and the gap between this and 0.000697 support is narrowing until ~June 2023 when they will meet.

Same story for NEAR/BTC…

We still see headwinds for the DeFi sector as higher cap names outperform. The sector’s dominance continues to be pulled towards 1-year support but we do note the possible bullish divergence being formed…
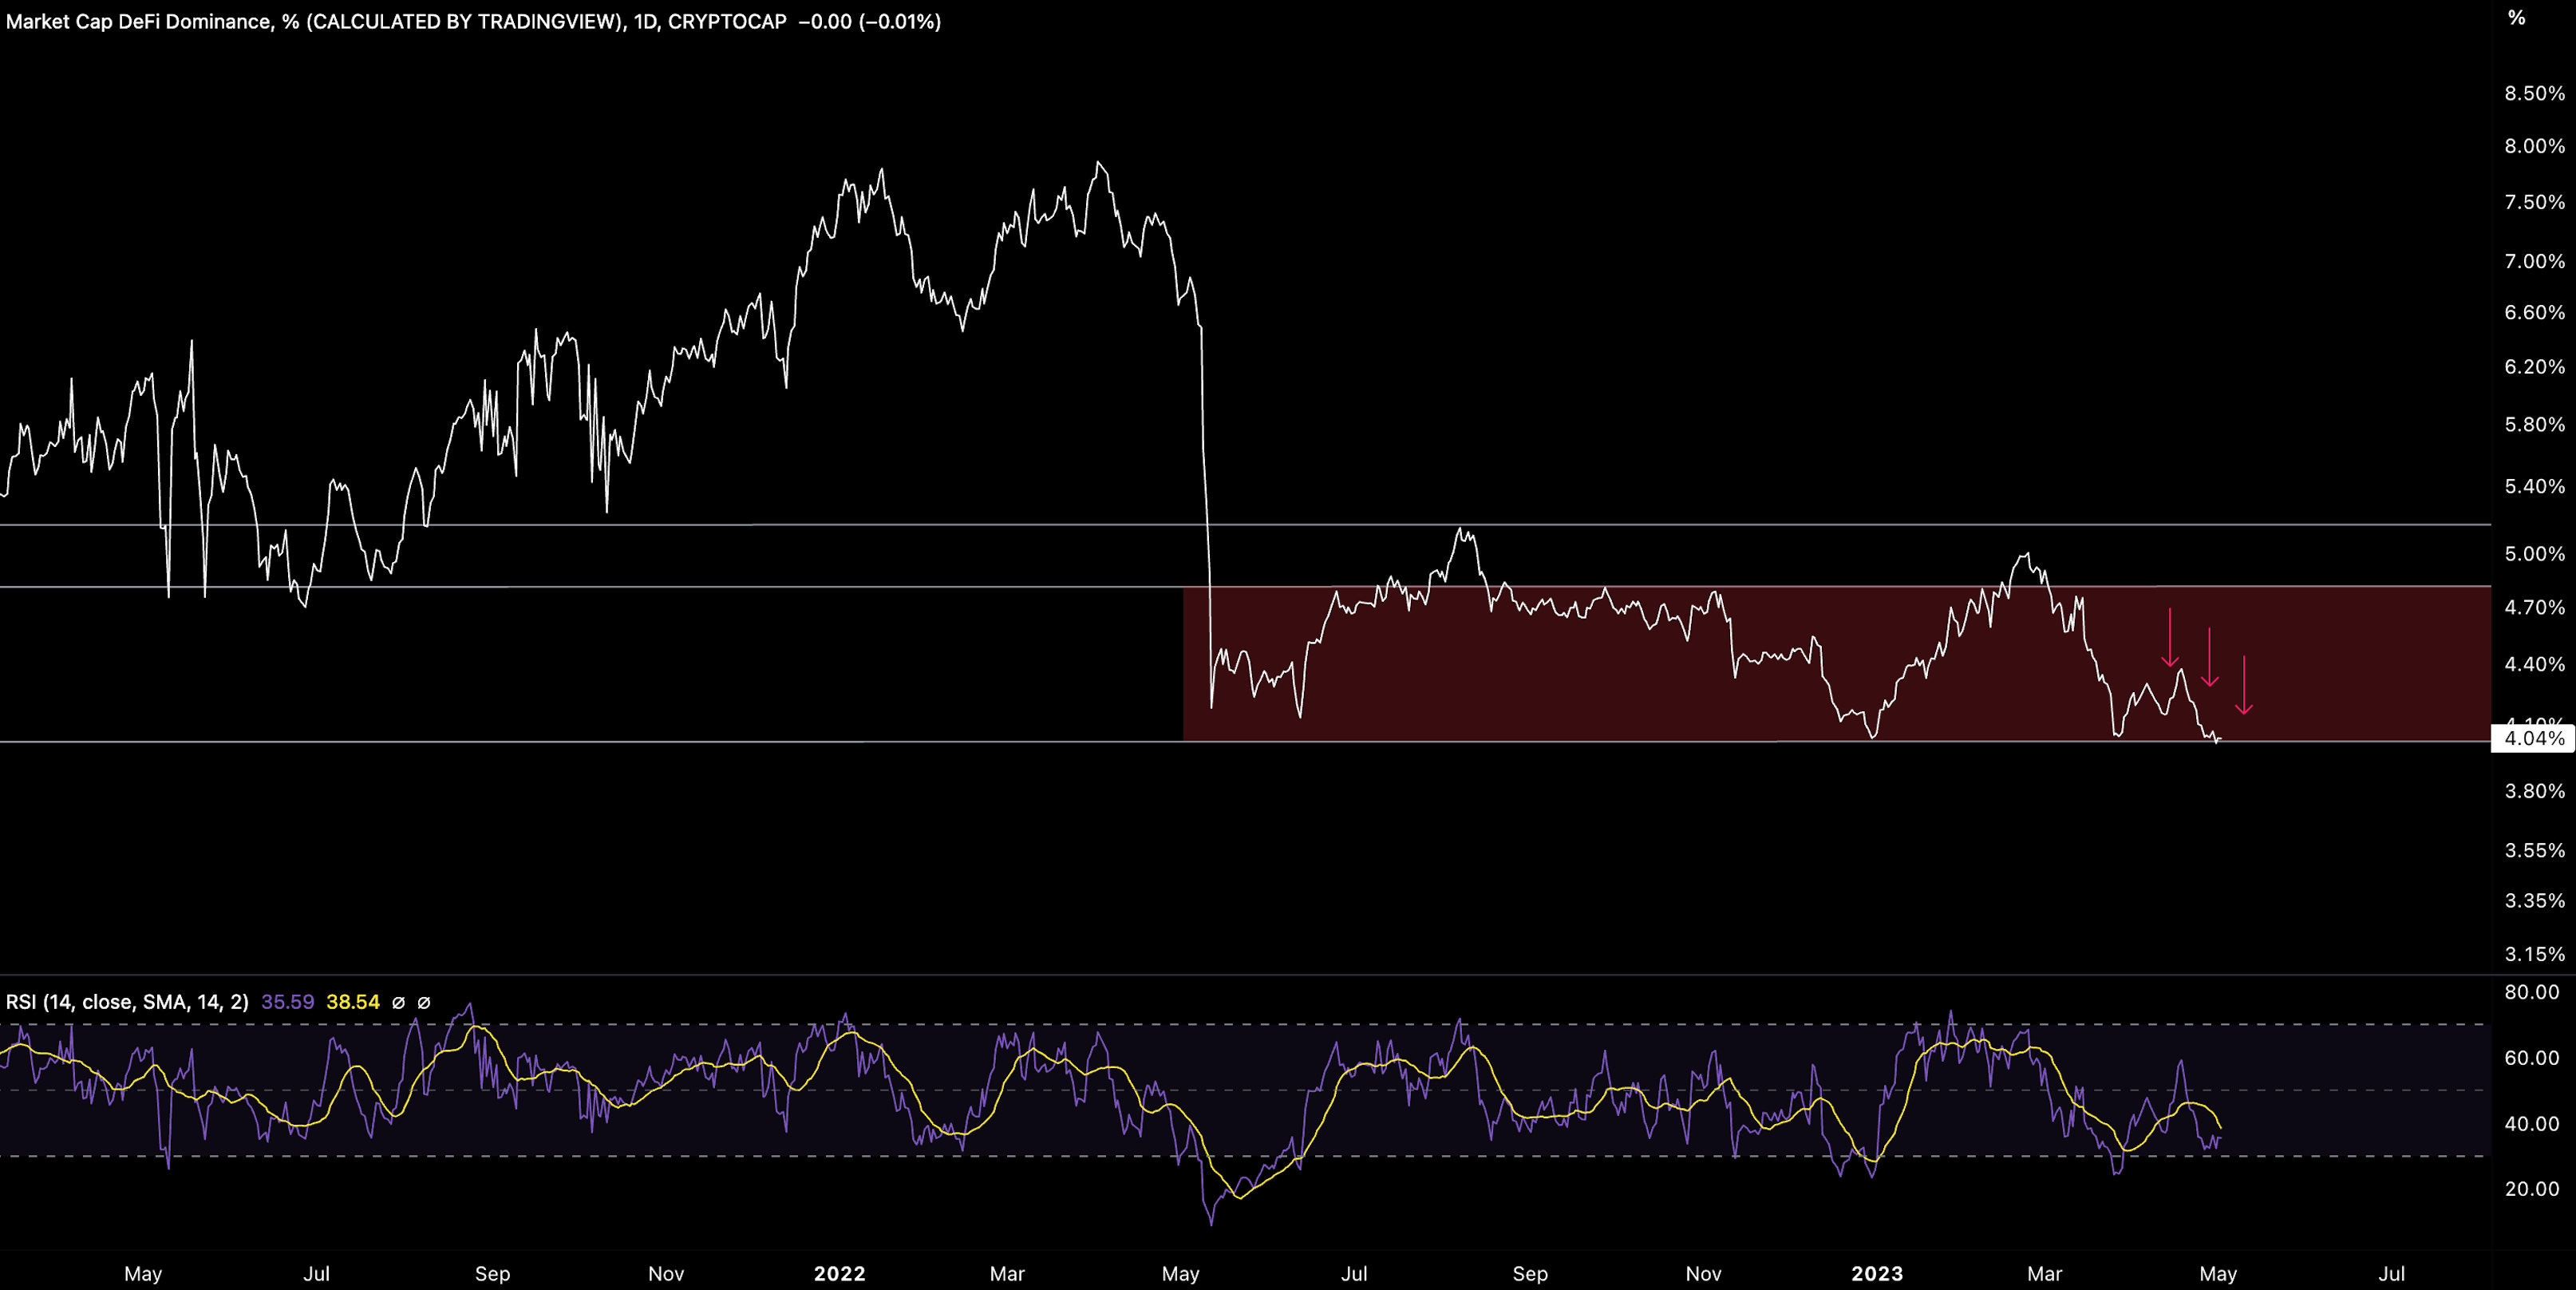
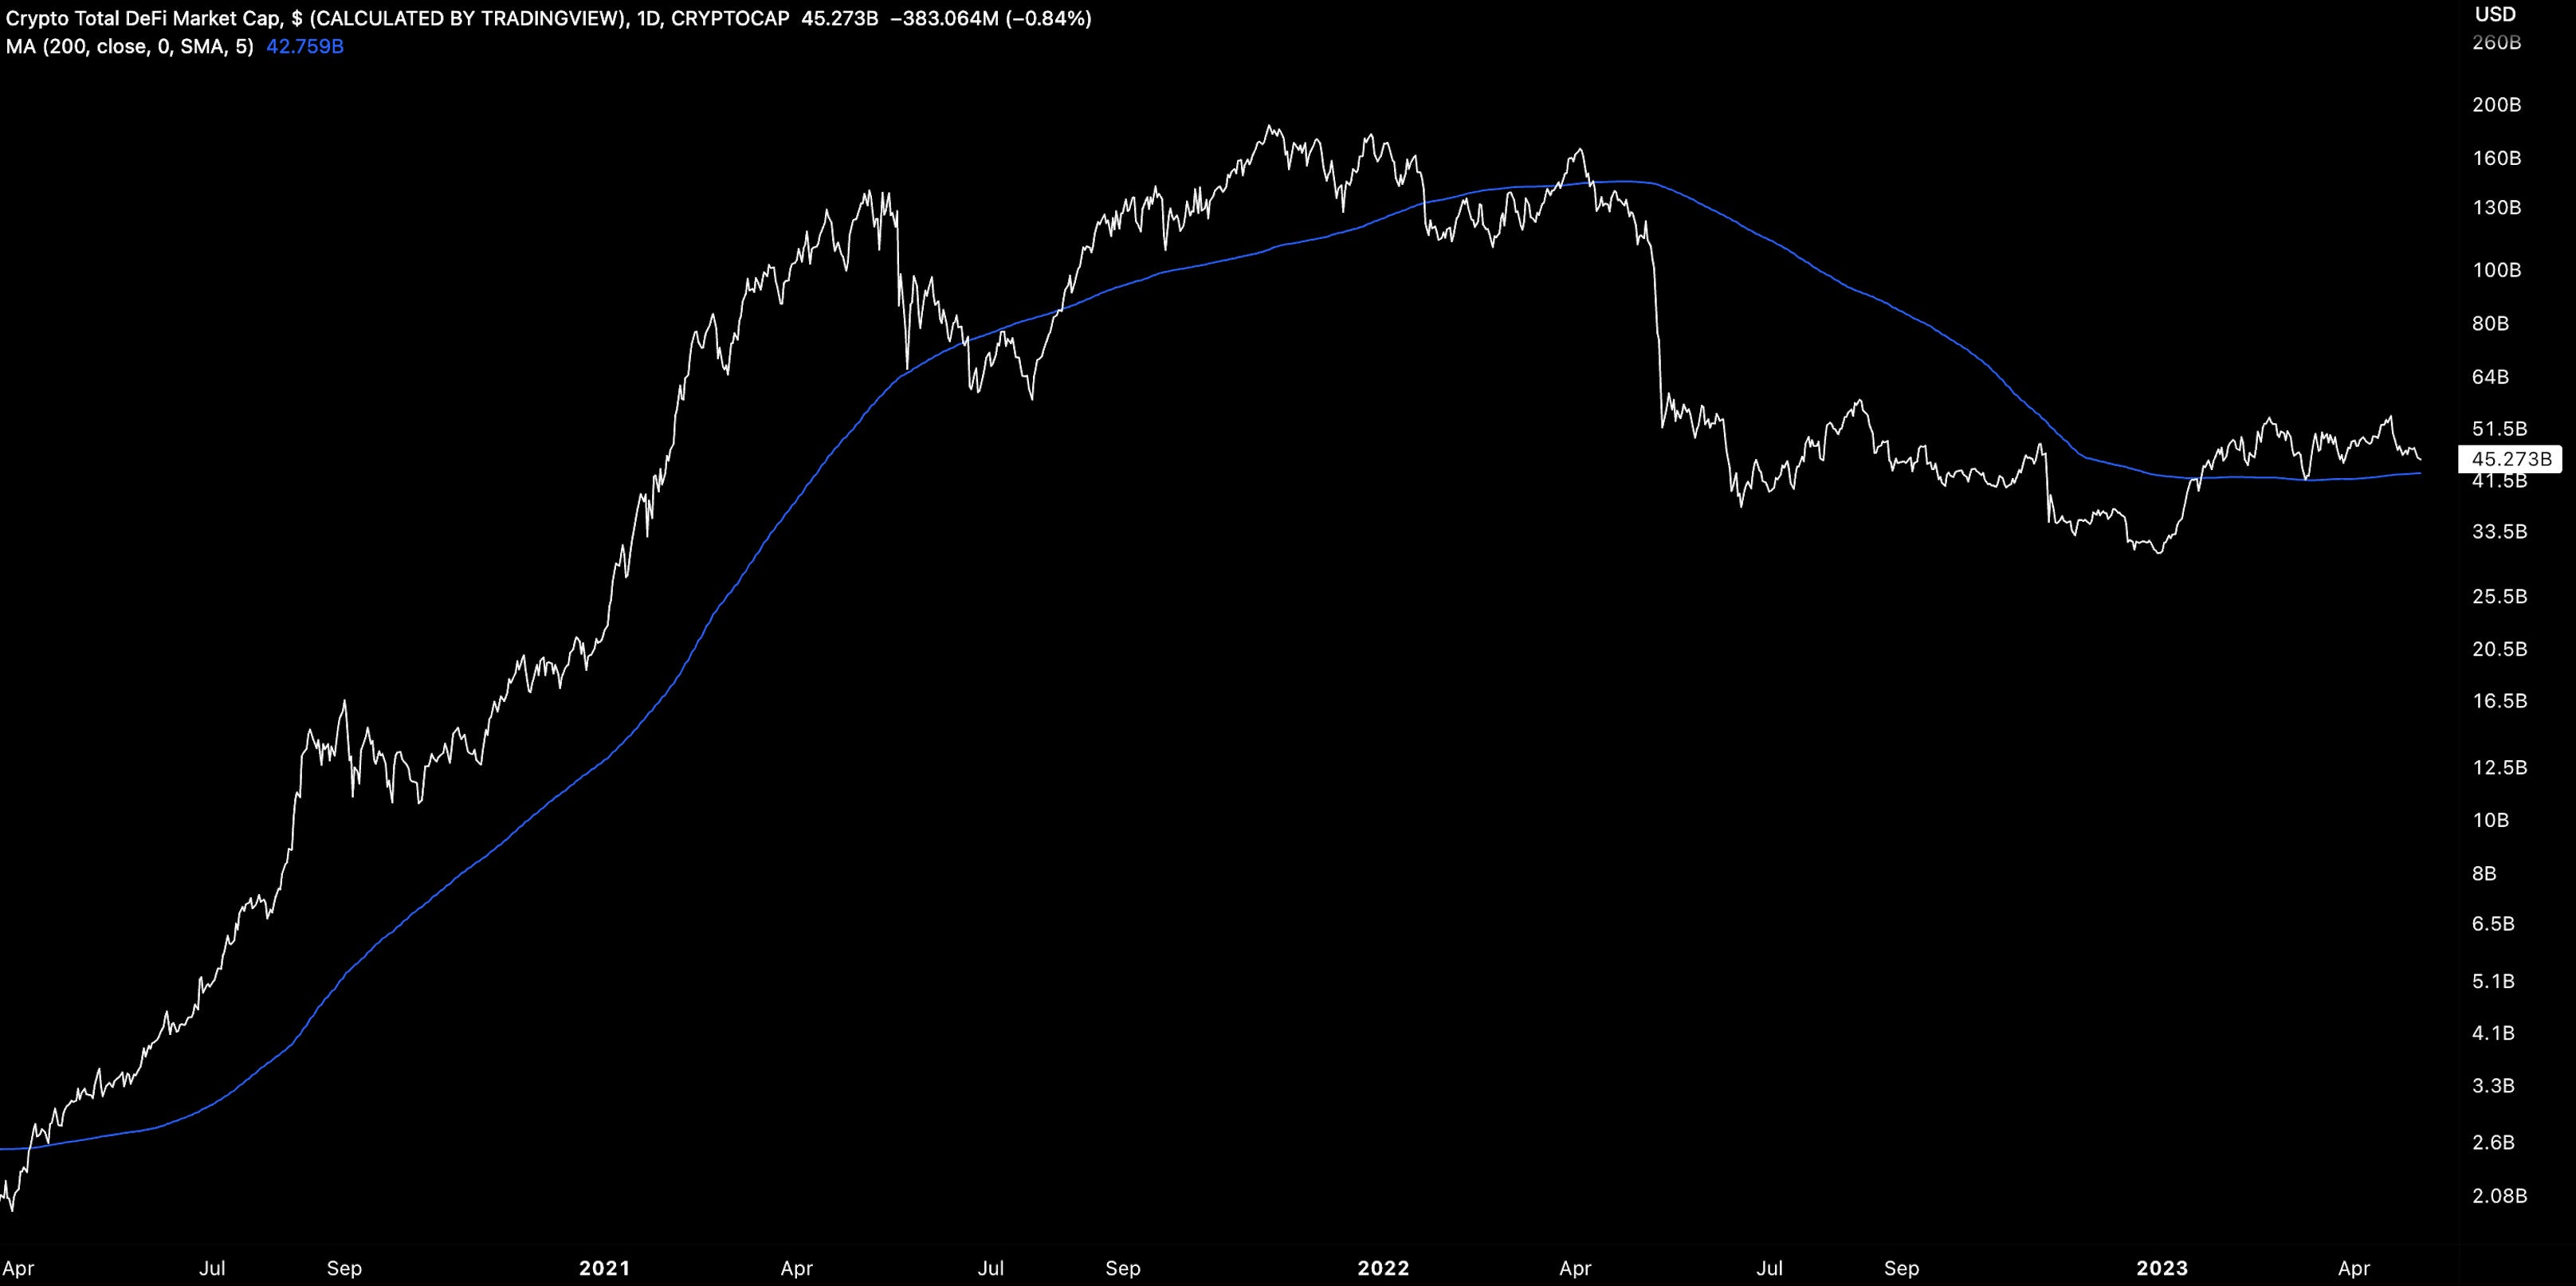
DeFi MCAP has also been kept below its 200W MA since October 2022…

Daily timeframes point to a sector trying to be more constructive by holding onto its 200d MA for support (again…).
A First Republic Takeover
Concerns around the banking crisis have been stabilized for some investors as JP Morgan takes over troubled First Republic Bank.
The perception of stability means a stronger dollar for now investors see a locked-in 25 BPS Fed rate hike on Wednesday, taking interest rates to 16-year highs. Until forces its hand, the Fed will maintain its hawkish bias.

But we see the rate hike exacerbating the problem causing the banking crisis for smaller players.

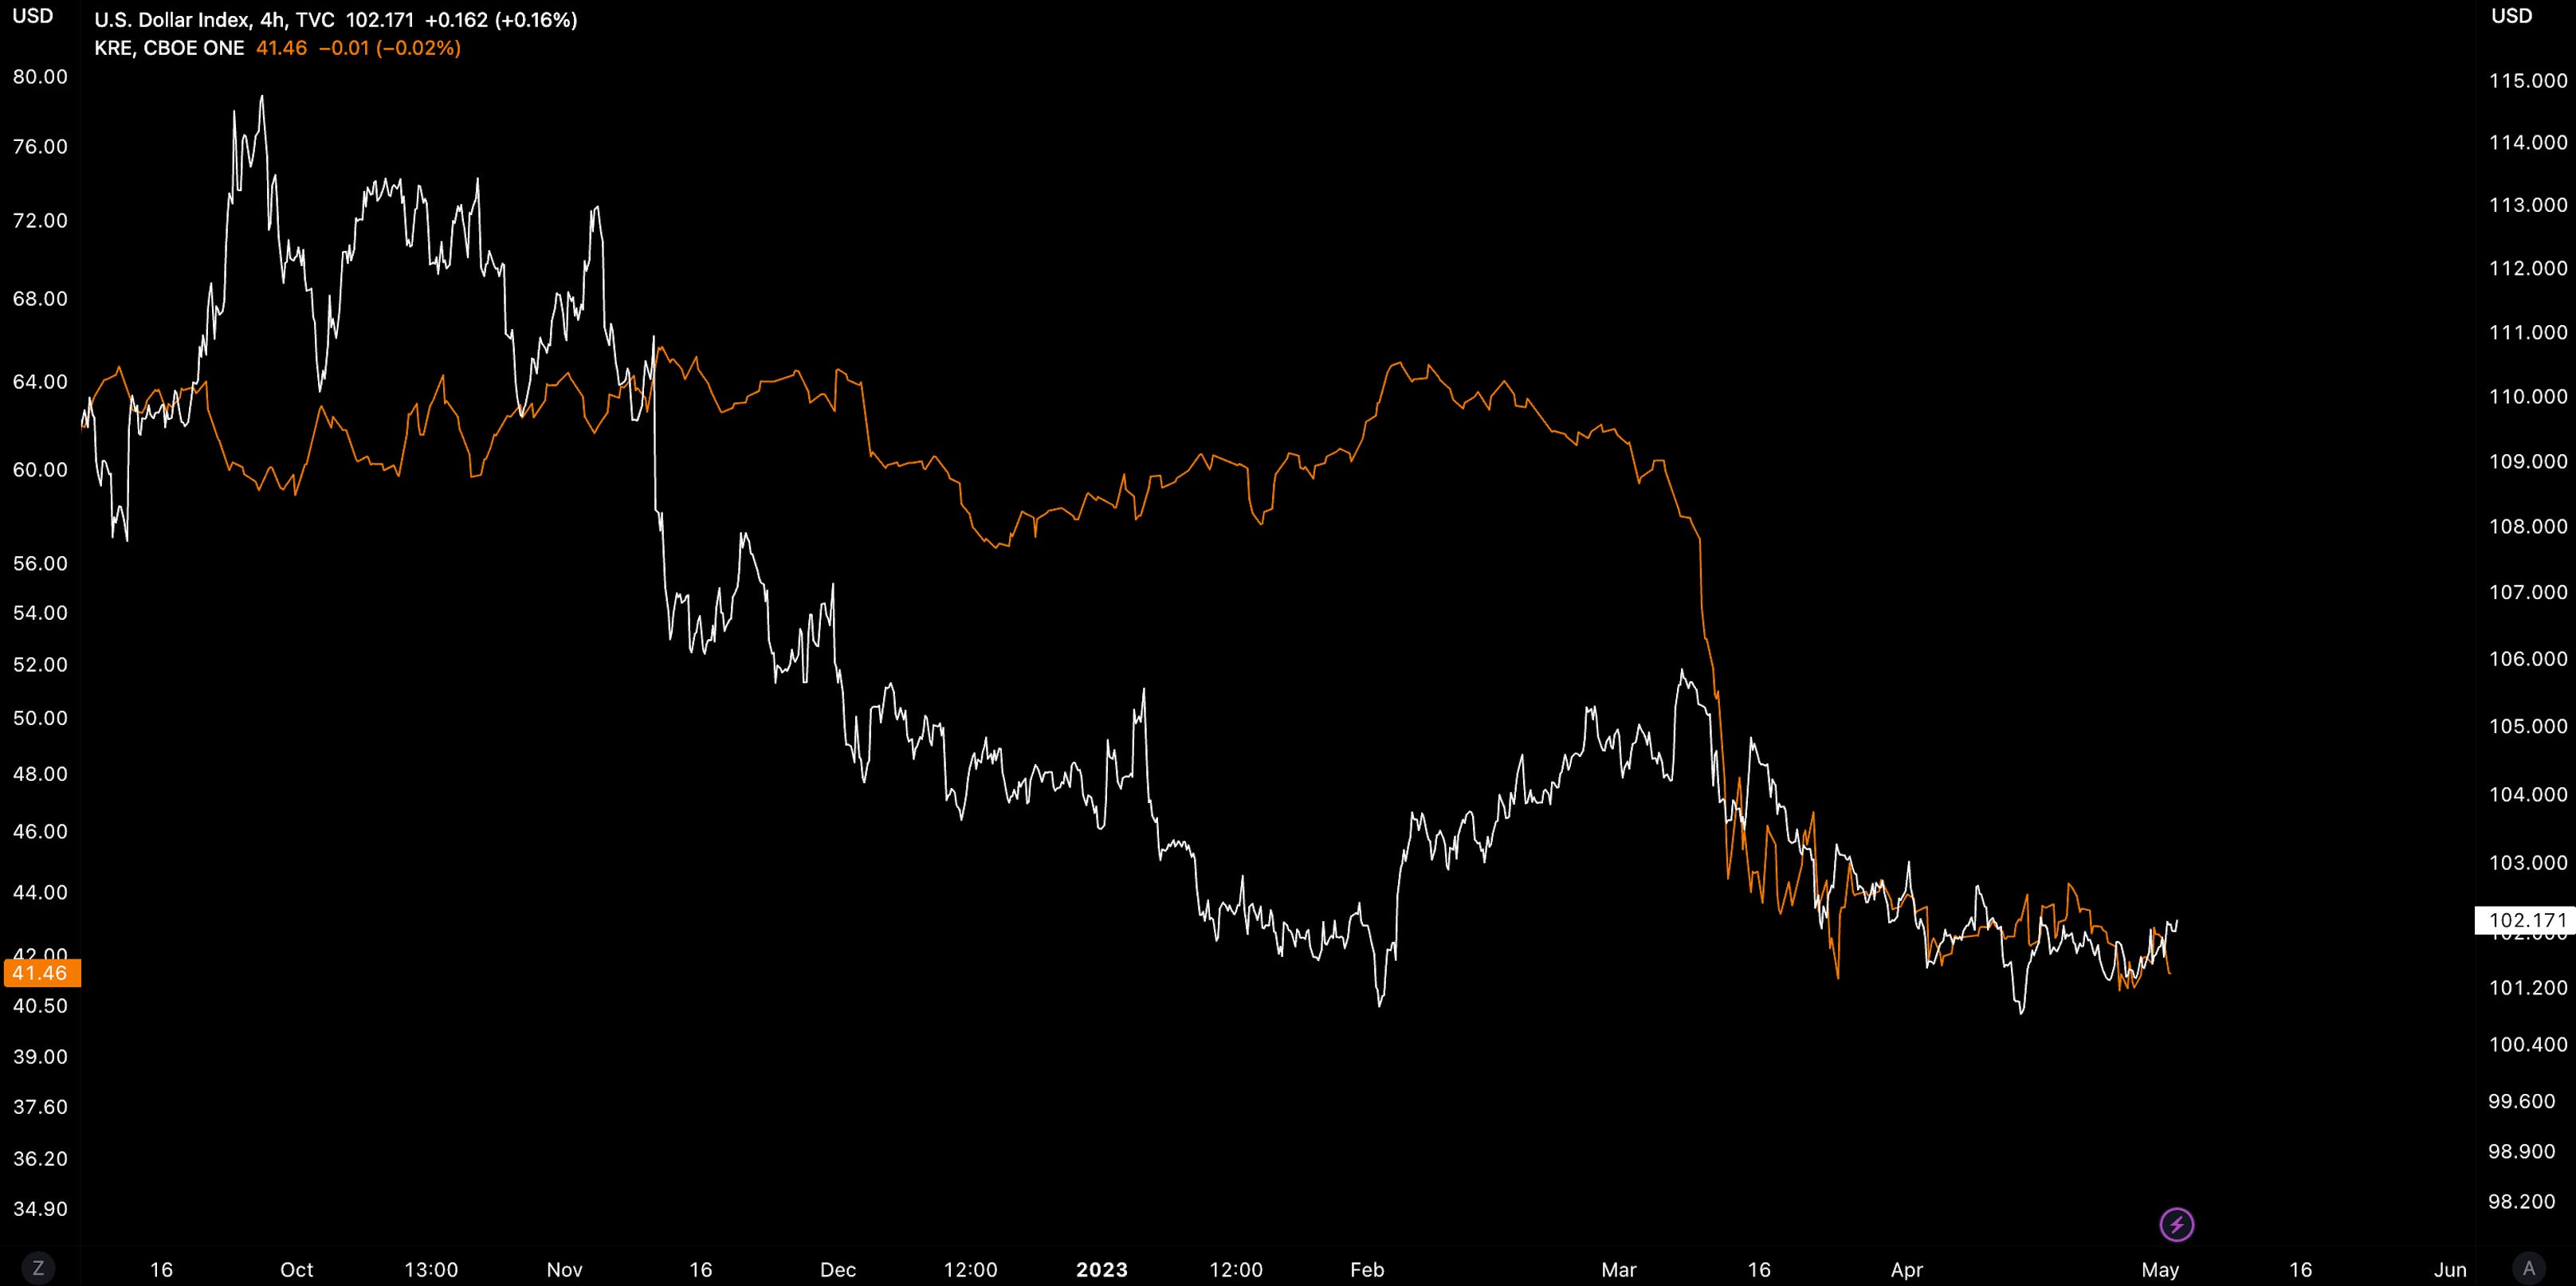
Regional banks are still under pressure…
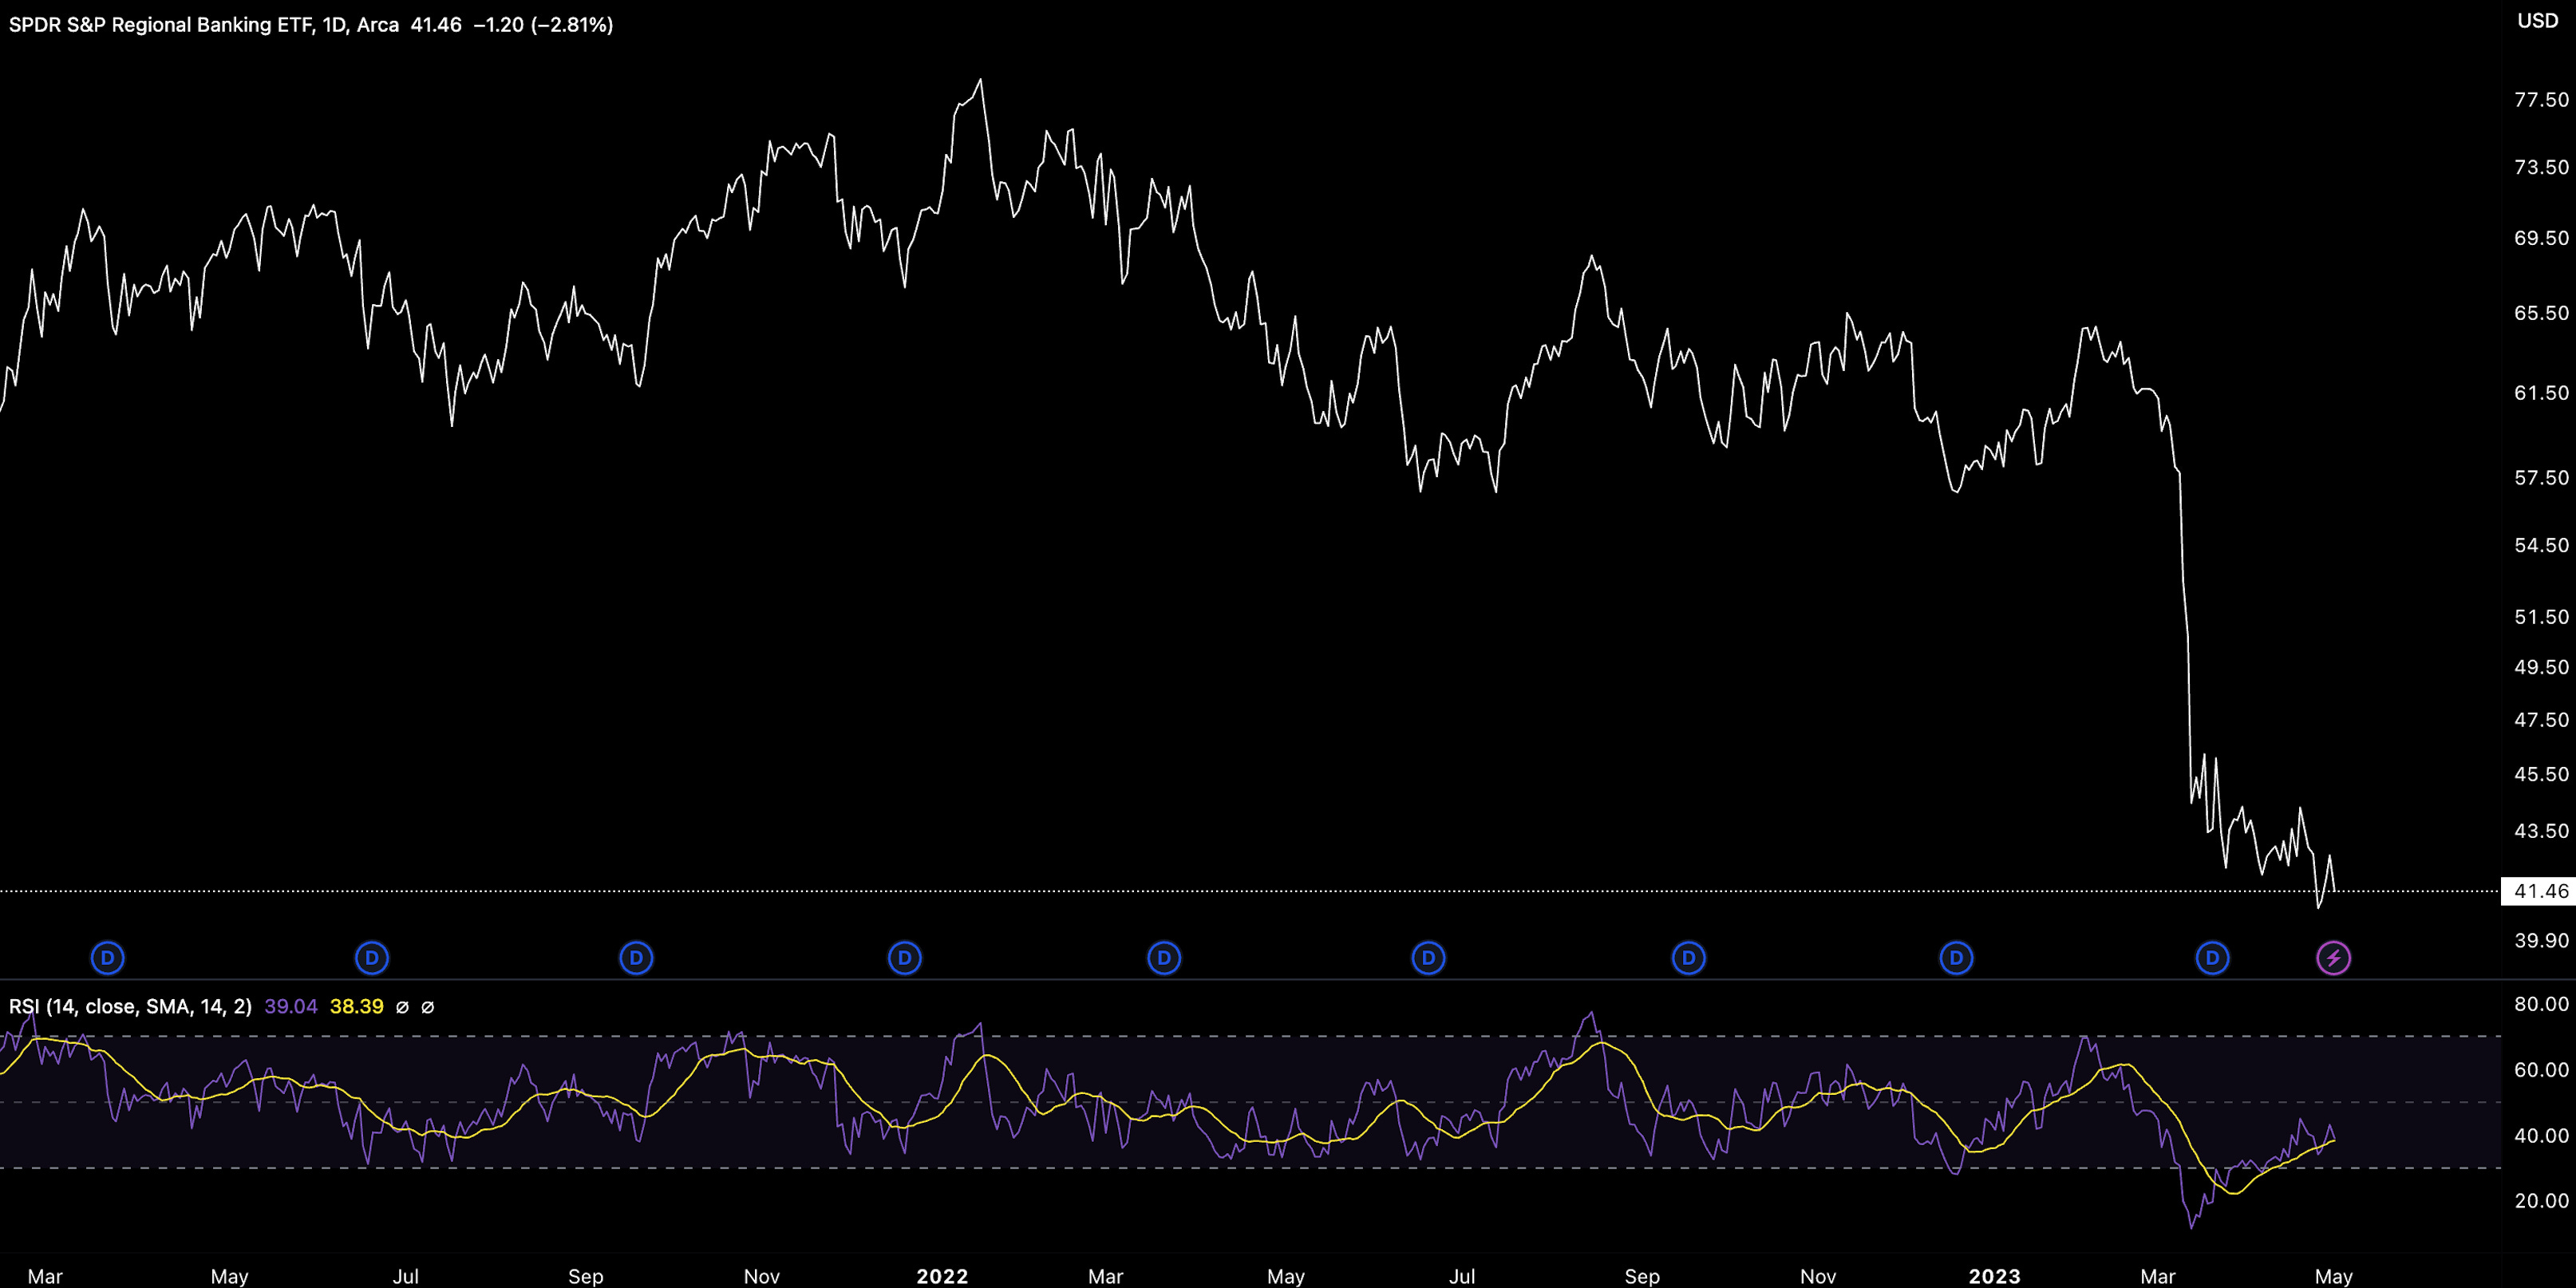
And a bet on regional bank weakness is a bet on dollar weakness too…
What’s bad for regional bank health is good for BTC dominance too. Bitcoin’s retreat in dominance on the day of the First Republic Bank takeover is no coincidence.

Market liquidity, both global and in the US has also been a factor in cryptoasset performance lately with both liquidity measures rounding off from their top in late March.
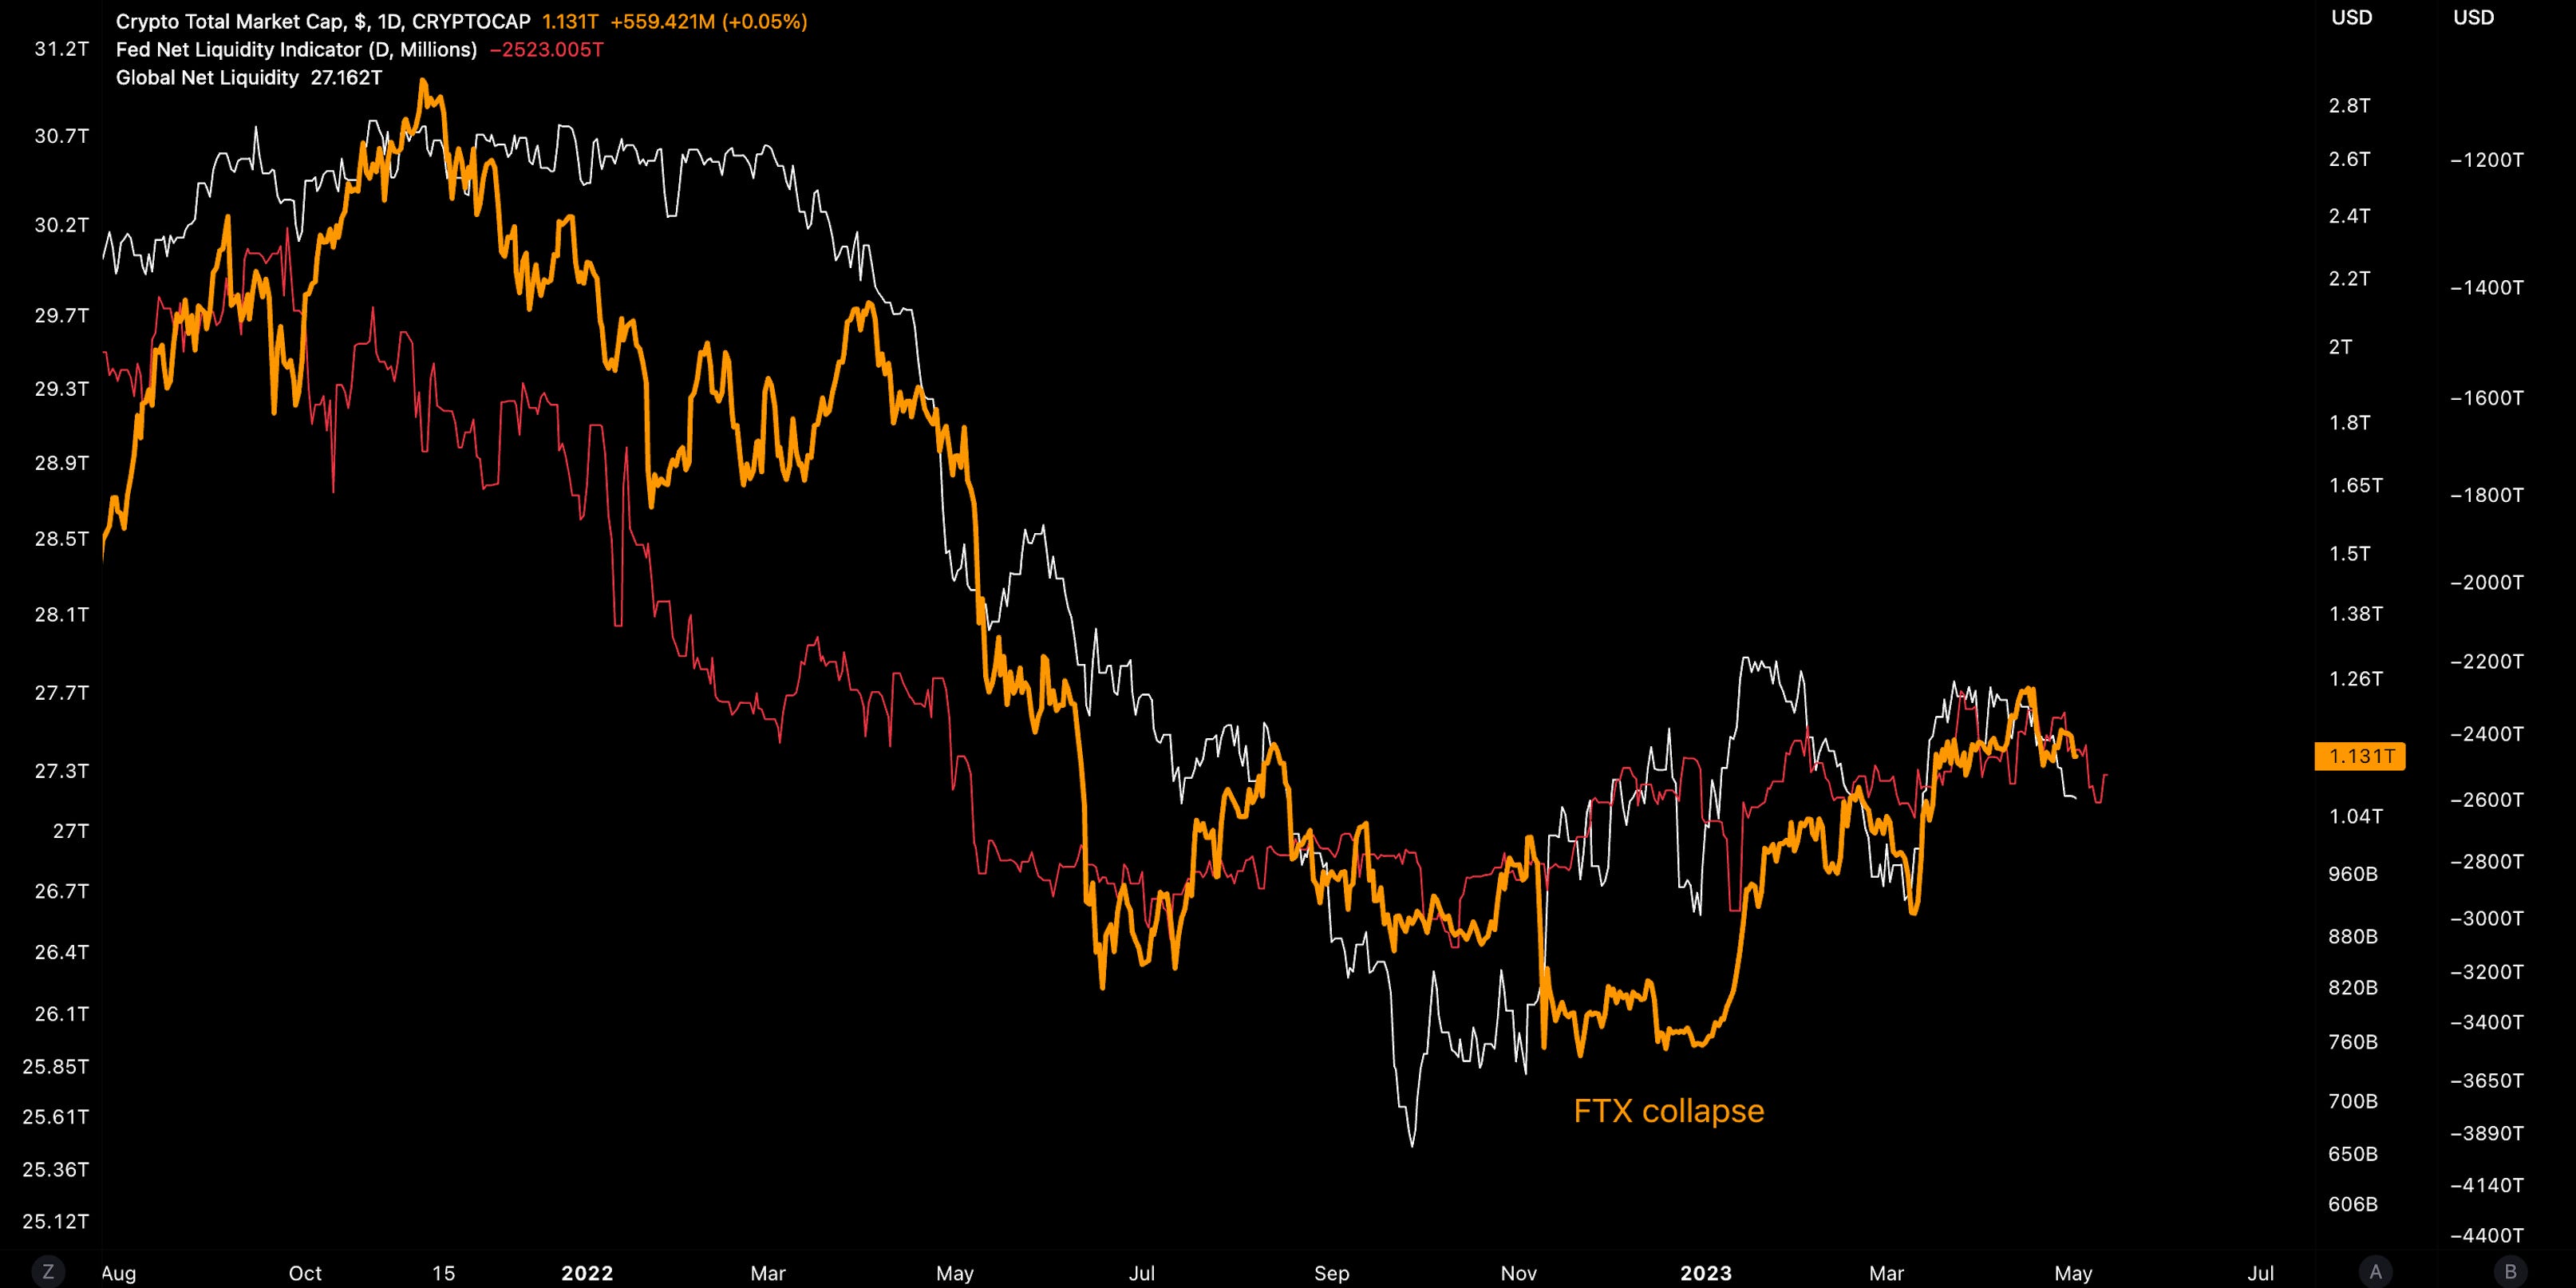
All is not lost though. The US debt ceiling approaches with Yellen stating the government will run out of cash by 1 June - much sooner than some anticipated.
The debt ceiling has been raised, extended or revised 78 times since 1960. This time is no different.
Incremental or gradual hikes in the US debt ceiling have been positive for cryptoassets with periods just before debt ceiling hikes (esp. with higher interest rates) being the worst periods for performance.
The fresh injection effect…

This also helps contextualise the 2017-2018 rate hikes having a little negative impact on performance. The first phases marked the period when the US needed to raise debt limits to fund normal operations as rates made it become more expensive to do so.
Assuming the government doesn’t default on its debt, this is the prime time for risk assets as the US raises the debt ceiling as rates move closer to their terminal rate.
So how to make sense of all of this?
The debt ceiling set-up is more constructive for risk assets than not. If we do see a corresponding rally with a raised limit, we’ll see if such a rally corresponds with a breach in Bitcoin dominance or outperformance.
Intuition from previous cycles would say Bitcoin dominance would buckle but unlike other cycles, Bitcoin has gained steam from the ongoing US banking crisis which has not been solved yet.
Likewise, the debt ceiling event may act as the catalyst for alt indicators to either break down or gain momentum.
Decentral Park Market Pulse

Want real-time updates and analysis on the digital asset market? Join Decentral Park’s Market Pulse group by clicking the link below:
Global Market Cap

$1.126T; Retreating back to $1.12T support once again with the market so far printing a 0.3% decline to the week.
DeFi MCAP


$45.3B; DeFi sector declined 0.8% last week with a further 3% decline this week. The sector remains above its 200d MA which we see as next support. The sector continues to trade below its 200W MA which has acted as a ceiling since October 2022.
Trader Positioning

BTC OI weighted funding rate shows traders maintaining a predominantly bullish stance as BTC slips below the $28k level.
~$114m in aggregate long liquidations occurred on Monday which may have contributed to price volatility.

BTC OI is still at $12B - the same level during February and mid-March. Liquidations aren’t impacting OI materially.

Grayscale Trusts
GBTC discount to NAV widening back to ~40% as BTC retreats from its April highs. Continues to be an approx high beta play on the underlying.

GBTC volumes (30D) are dropping to 3-year lows (2.84m) illustrating the low-interest environment for the product. Bullish investors may just be seeking physical BTC without wanting to take on SEC decision risk.

ETHE’s discount to NAV widened back to ~53%. ETHE likely carries a higher discount relative to GBTC due to the SEC decision attributed to GBTC only).

BTC/USD Aggregate Order Books

Order books look slightly heavier on the bid side. Heavier resistance up to $28.5k.
Miners
Bitcoin hash rate continues to edge higher once again (348m TH/s).
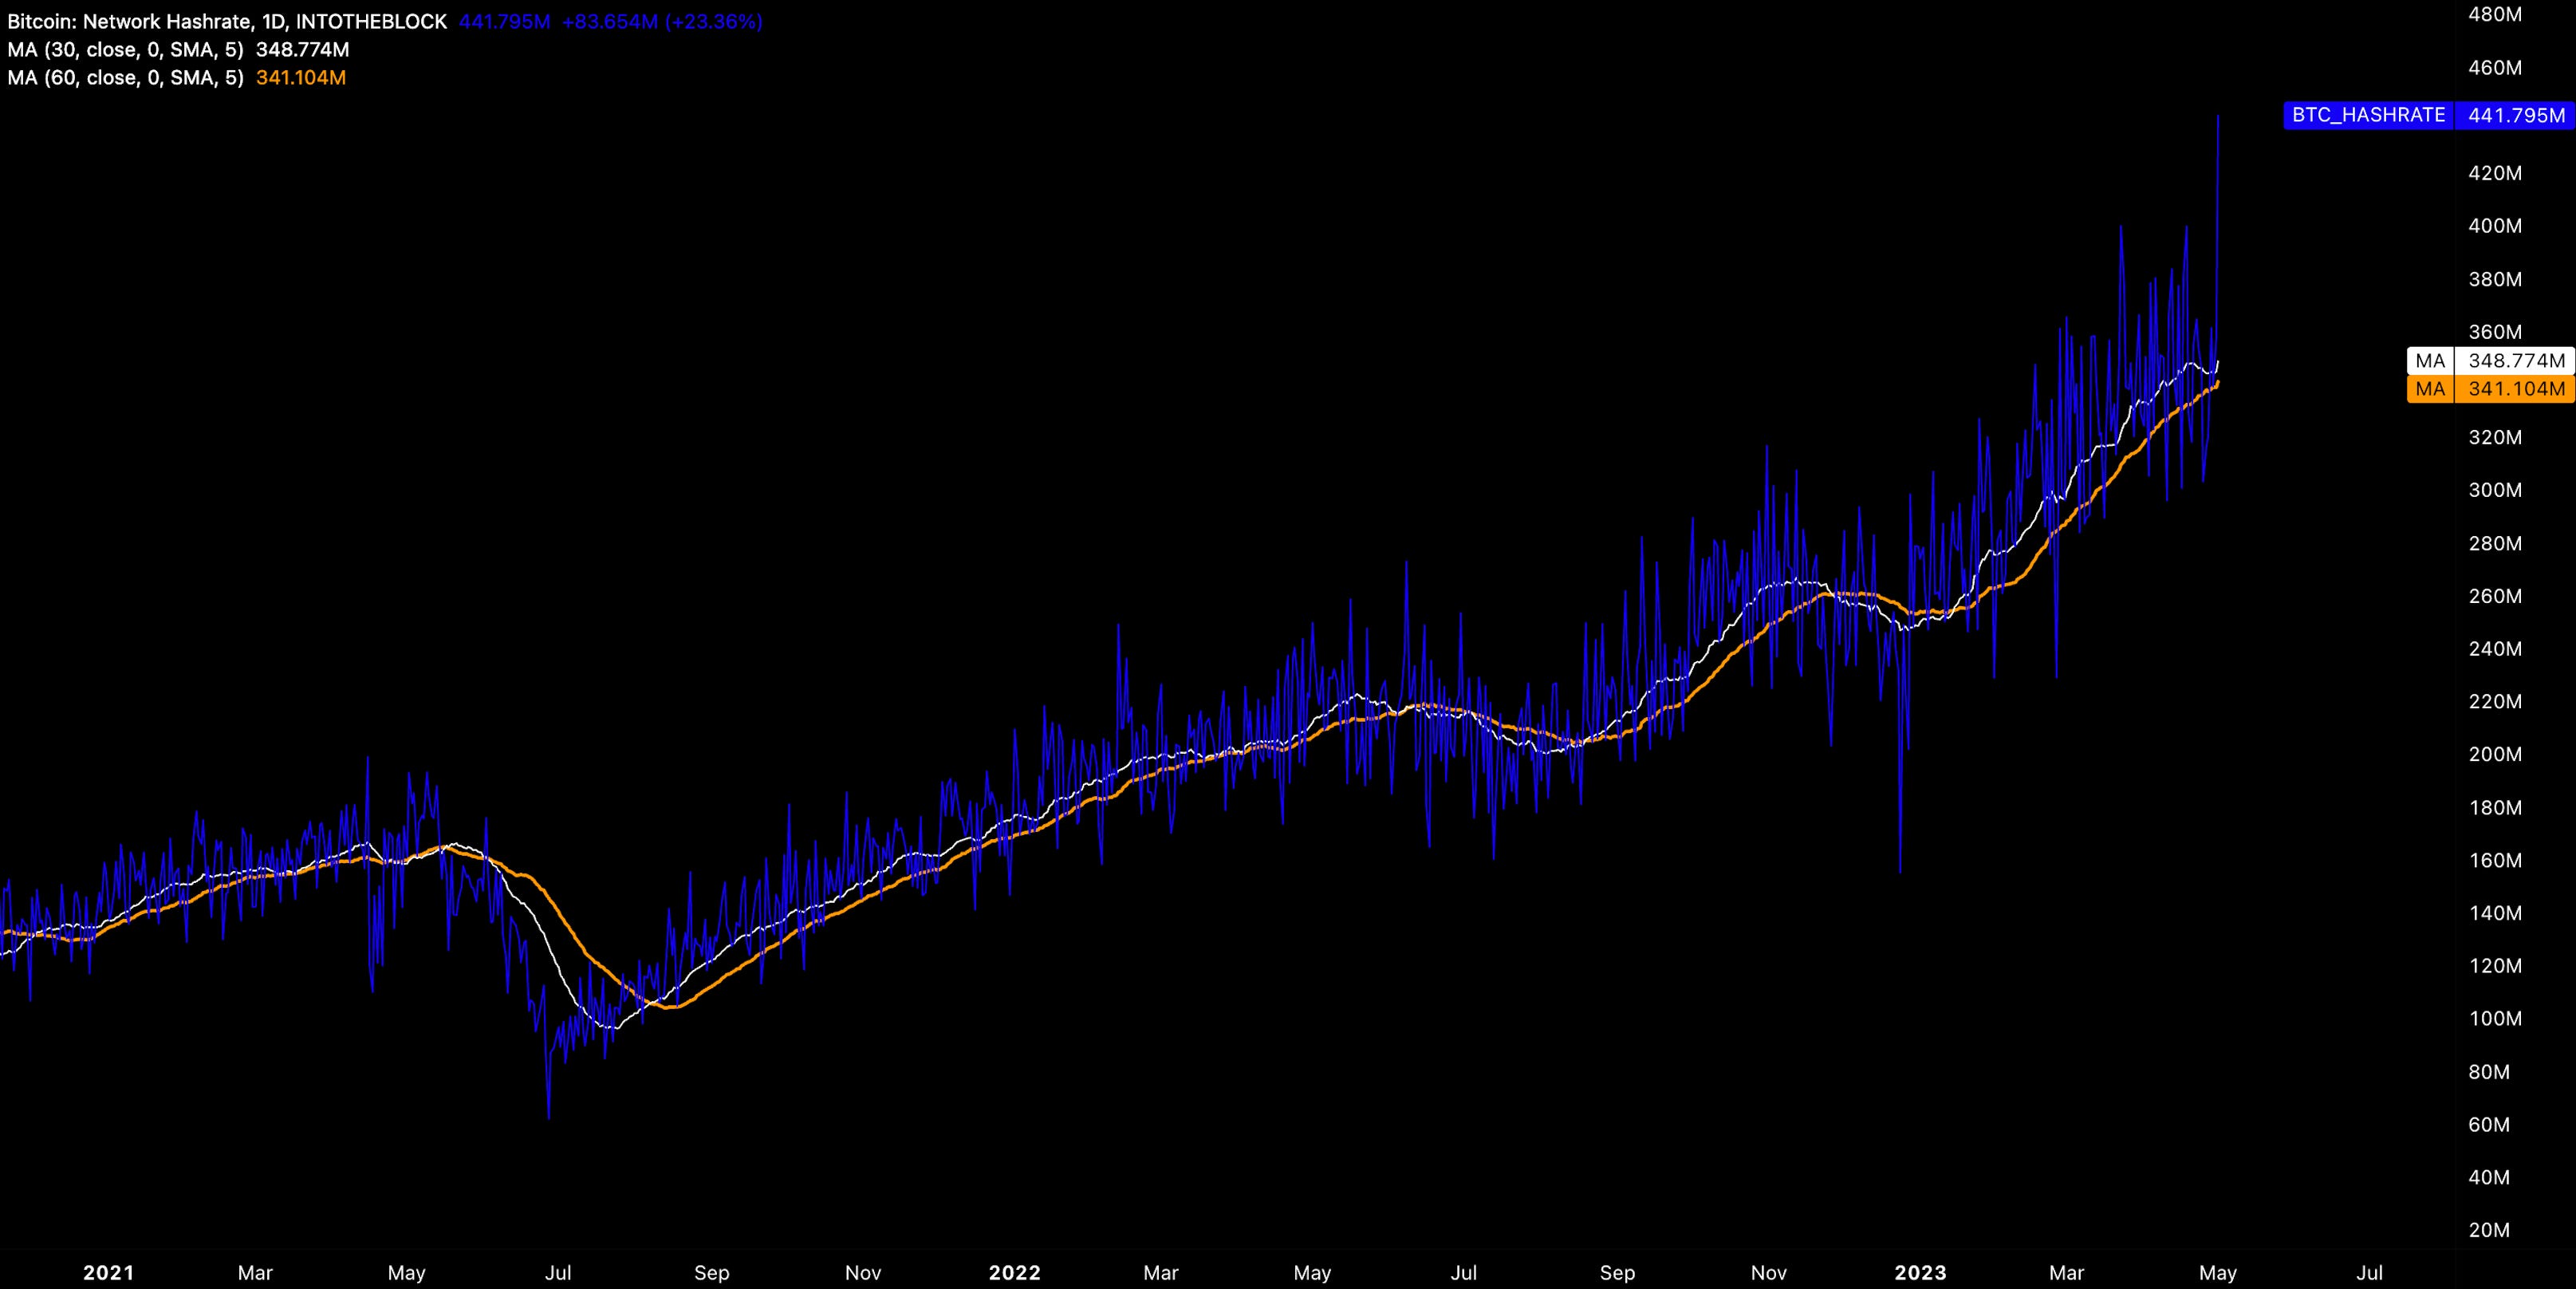
Energy price deflation may also be fueling miner resource commitments with natural gas prices remaining below $3 in 2023 vs. 2022’s $6.45.

Hashprice has spiked over the past week due to corrective spot action but we still see an overall decline in the index in 2023 as the more likely scenario over a longer-term time horizon.

Bitcoin profitability edges higher form its 3-year low which we see as adding support to the end of the Bitcoin miner capitulation cycle.


The highest-performing assets over the past week have largely been mid-cap names (34-90 MCAP ranked):
Top 100 (7d %):
Pepe (+292%)
Render (+17.2%)
Casper Network (+16.6%)
Cronos (+11.2%)
Injective (+7.7%)
Bottom Top 100 MCAPs (7d %):
Ziliqa (-14.7%)
PancakeSwap (-13.2%)
Toncoin (-9.8%)
Flare (-8.0%)
Flow (-7.9%)
> Increased liquidity is causing a paradigm shift in NFT markets [The Block]
> Raoul’s Unified Thesis on NFTs [Real Vision]
> Why Are We Still Building Layer 1s? [Unchained]
> Coinbase’s Legal Action Against the SEC [Unchained]
> The Wallet Wards [Bell Curve]
> Sotheby's Launches On-Chain Secondary NFT Marketplace [Coindesk]
> On Sovereign MEV [Delphi Digital]
> BluerLoans [Dune Analytics]
> Nationalising the US banking system [Arthur Hayes]
> Benefits of Early Restaking [EigenLayer]
The information above does not constitute an offer to sell digital assets or a solicitation of an offer to buy digital assets. None of the information here is a recommendation to invest in any securities.