


Join the 1000’s of founders, investors, crypto funds, brokerage firms, and developers in getting free cutting edge crypto research by subscribing below:
Pullback Heading into Rate Decision Galore
Another week in crypto, another week of consolidating price action. Global market capitalization reached our resistance target of ~$1T (+4% W) before retreating back to the 200W MA on Monday morning (-2.15%). For the majors, BTC managed to stay above $23k while ETH remained buoyant above $1.6k.
Monday has come with corrective price action with BTC now testing $23k support and ETH now breaking below $1.5k.
On the technicals, the 200W MA has become sticky for global MCAP while weekly momentum indicators like RSIs stay neutral.

Traders continue to be caught off guard with the outperformance of BTC relative to the consensus name, ETH. After consolidating for several days at the 0.069 level, ETH/BTC looks to be moving to our target zone (0.065-0.066) with what appears to be the last innings before its next leg up against the orange coin.

It seems reasonable that for now markets stay broadly range-bound after correcting from current levels.
We continue to believe that macro is the single biggest driver of cryptoasset prices aside from forced selling which appears to be largely behind us.
Equity indices like the S&P 500 remains positively correlated with most cryptoassets across a number of sectors. When the correlation breaks down (recent days), this asymmetry has been from crypto moving down vs. SPX moving higher.
A reasonable scenario coming out of the current rate hike cycle is for the crypto markets to recover first as the most risky markets have the 20:20 vision for inbound tailwinds very far out. However, as we see in correlation analysis, this is not the case today.

This week is a big macro event week too with volatility likely to ensue with upside/downside surprises:
Wednesday: FOMC rate decision, Eurozone PMI/CPI
Thursday: ECB rate decision, UK BOE rate decision, US factory orders/initial jobless claims
Friday: US unemployment, nonfarm payrolls
The Fed is expected to raise 25BPS with a continuation of QT while the ECB is likely to hike 50BPS. When the Fed hike 25BPS+ this week, the Fed Funds Rate will move above core PCE (the Fed’s preferred measure of inflation) for the first time since 2019 - a sign that the magnitude of the Fed’s rate hikes maybe fast approaching the desirable levels.
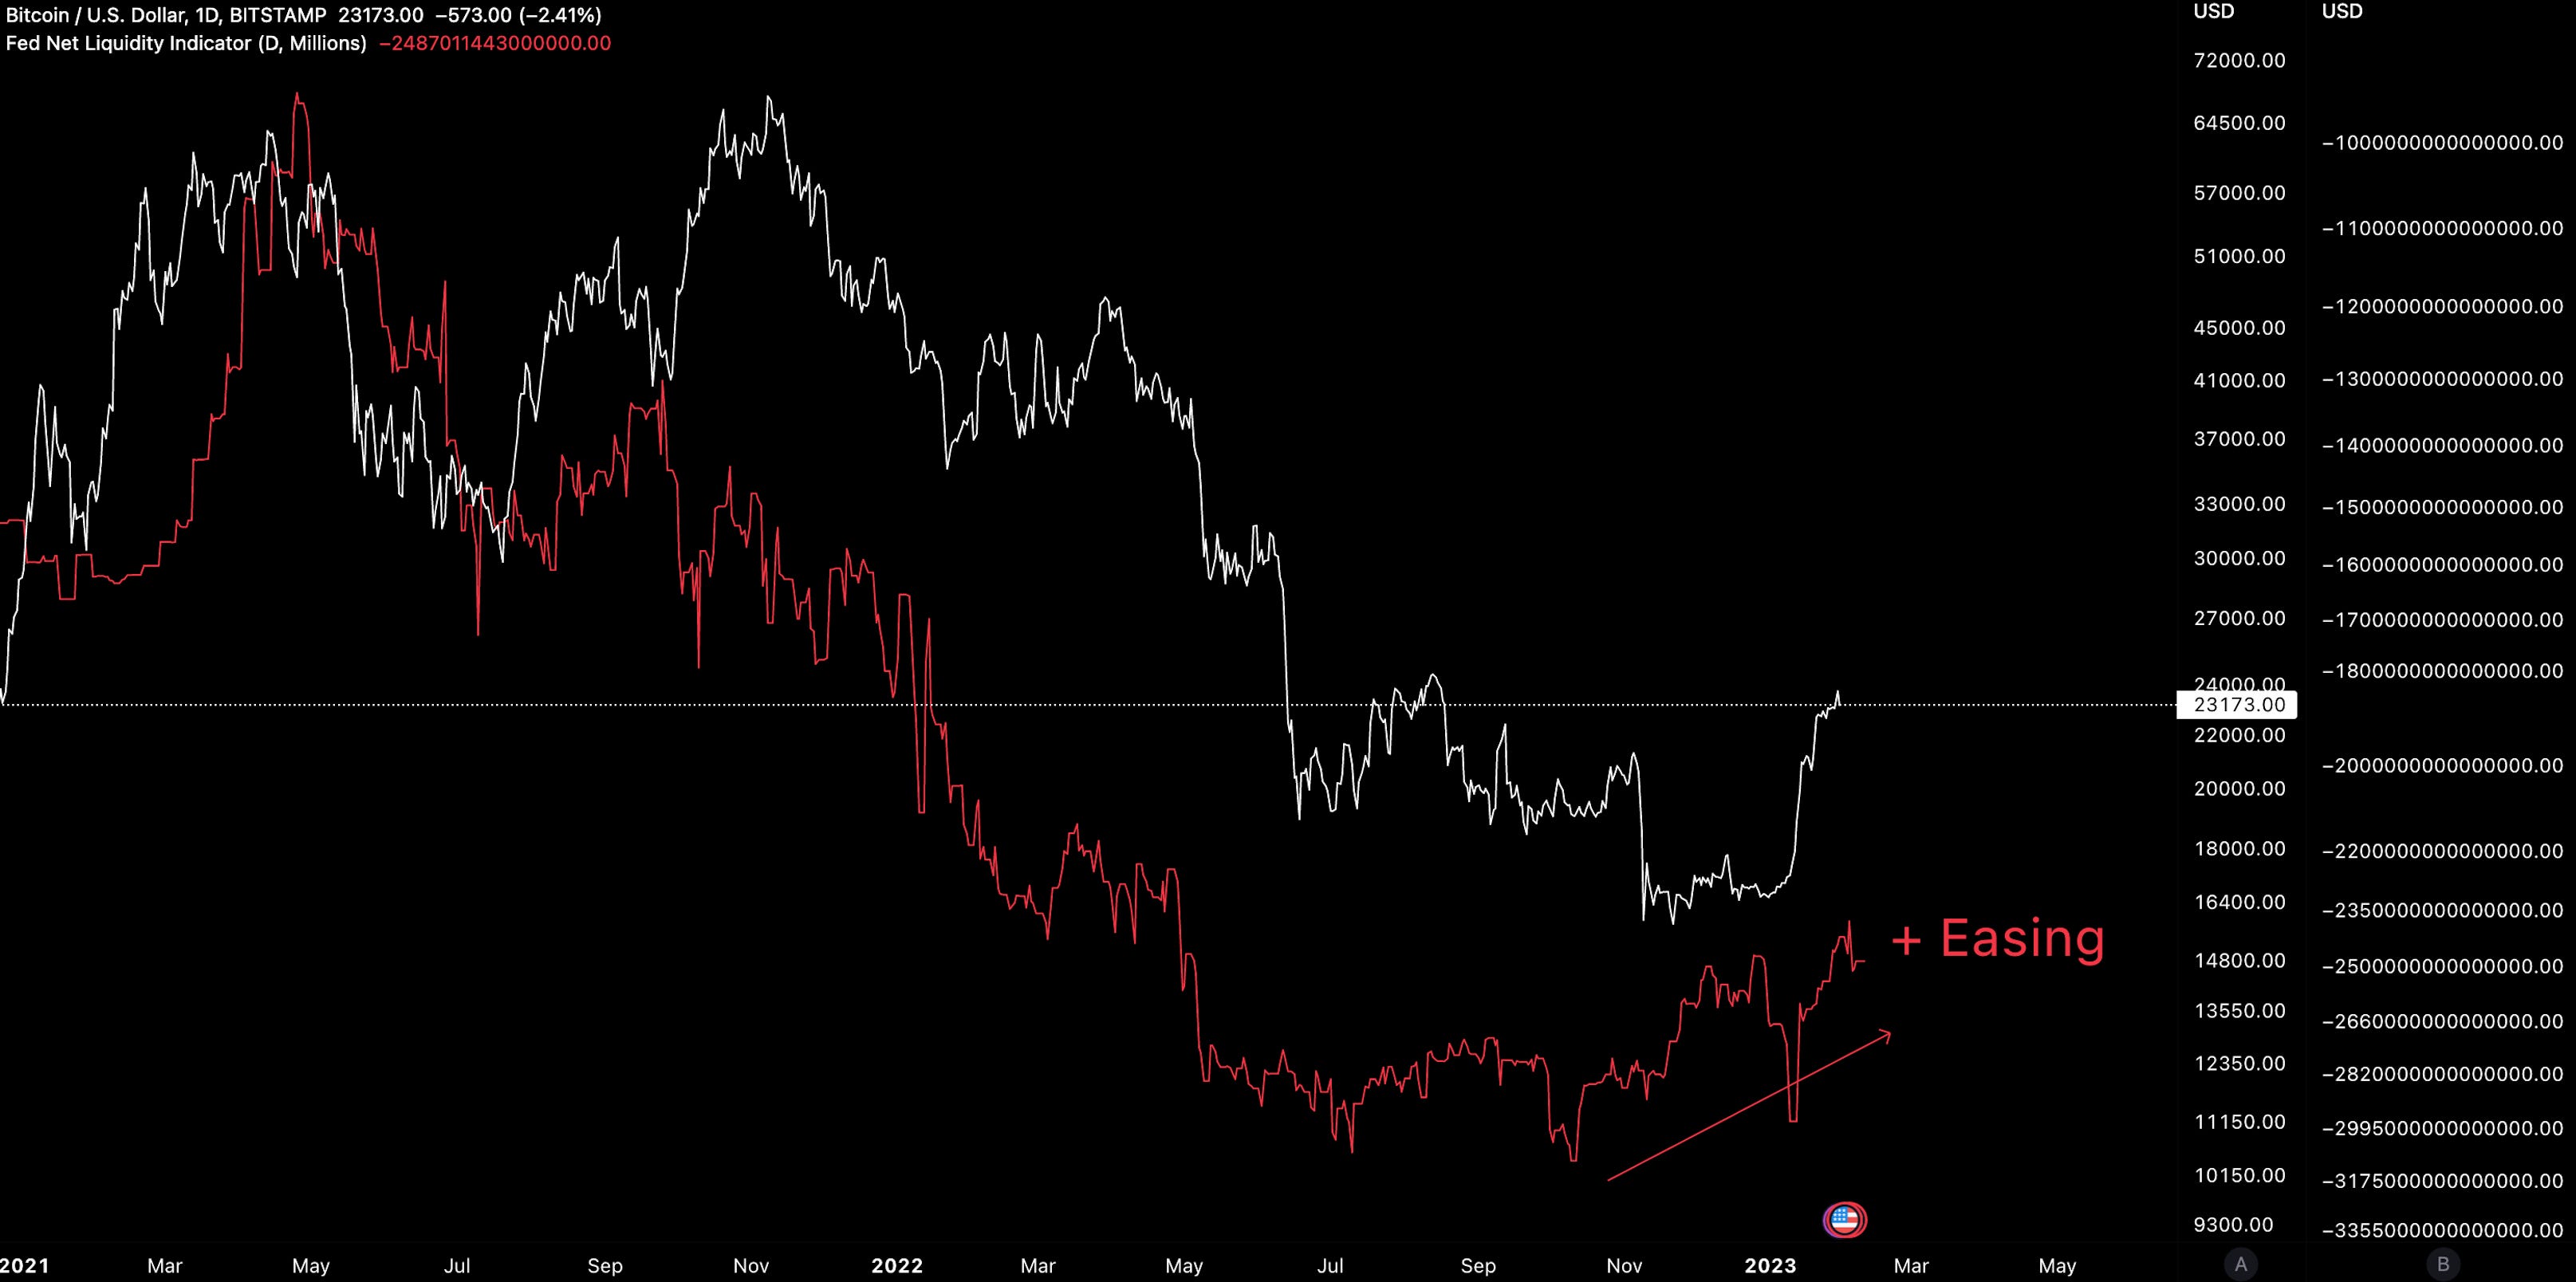
Financial conditions are loosening and that’s supporting price action. It’s also part of the problem.
There are reasons to be optimistic for risk assets (including crypto). One of them is positive GDP data coinciding with falls in headline CPI numbers. GDP rise at a 2.9% annualized pace, down from 3.2%. US equities rose as a result, likely forecasting a stronger likelihood of a softer landing.

However, the economic data can be the ‘double-edged sword’ for central banks like the Fed. As we have highlighted several times before, financial conditions have been loosening since October 2022 with the US Treasury counteracting the Fed’s QT efforts by drawing down its cash account by over $600B since mid-2022.
History has taught us that being able to predict hard/soft landings is quite hard.
Risk asset rallies have coincided with this loosening and is a key catalyst for positive GDP prints (above trends and expectations). This was the case last week as we note above. The issue then manifests potentially over into the labor market where better than expected growth bolsters an already tight labor market.
On top of this, rallies in markets is a sign of financial conditions loosening - continuation of the dynamic over the past few months. Moving in the opposite direction of where the Fed is looking for.
While the rate of change in CPI is likely to come down sharply, we see the concern centering around the 3-5% chunk for core inflation. This would be far above the Fed’s 2% target. The core measures exclude volatile items like energy and food suggesting that price pressures are still widespread.
The issue of core inflation is now moving markets with Spanish core CPI presenting a big upside surprise (+7.5%) while overall inflation rose 5.8% vs. a 4.8% est.
Core Inflation Worries
European and US equities weakened (e.g. NASDAQ 100 -1%) while European money markets increased their ECB rate-hike wagers by 8BPS to peak above 3.5%. These moves reaffirms that the market is biases towards lower inflation and surprise risk remains on the hawkish side.

Still, core and overall annual PCE in the US climbed at the slowest pace since 2021 which is directionally positive. Our expectation on Fed language this week to double click on the strong labor market while also not declaring ‘victory’ until their ‘2% goals’ are achieved.
So taken together, we remain in a state of limbo. Further upside in risk assets (driven by the market pre-empting monetary policy shifts) and inflation present challenges for the respective central banks.
Cryptoassets will likely follow equities on the downside while any breakdown in the positive correlation in performance between the two markets likely coming from equity upside/crypto downside.
That said, risk assets may fare well over February/March due the US treasury issuing bills post debt ceiling being reached which may also coincide with a reduction in ON RRP. The risk may then come after March when a debt ceiling deal is reached that can leave QT can be left to its own devices.
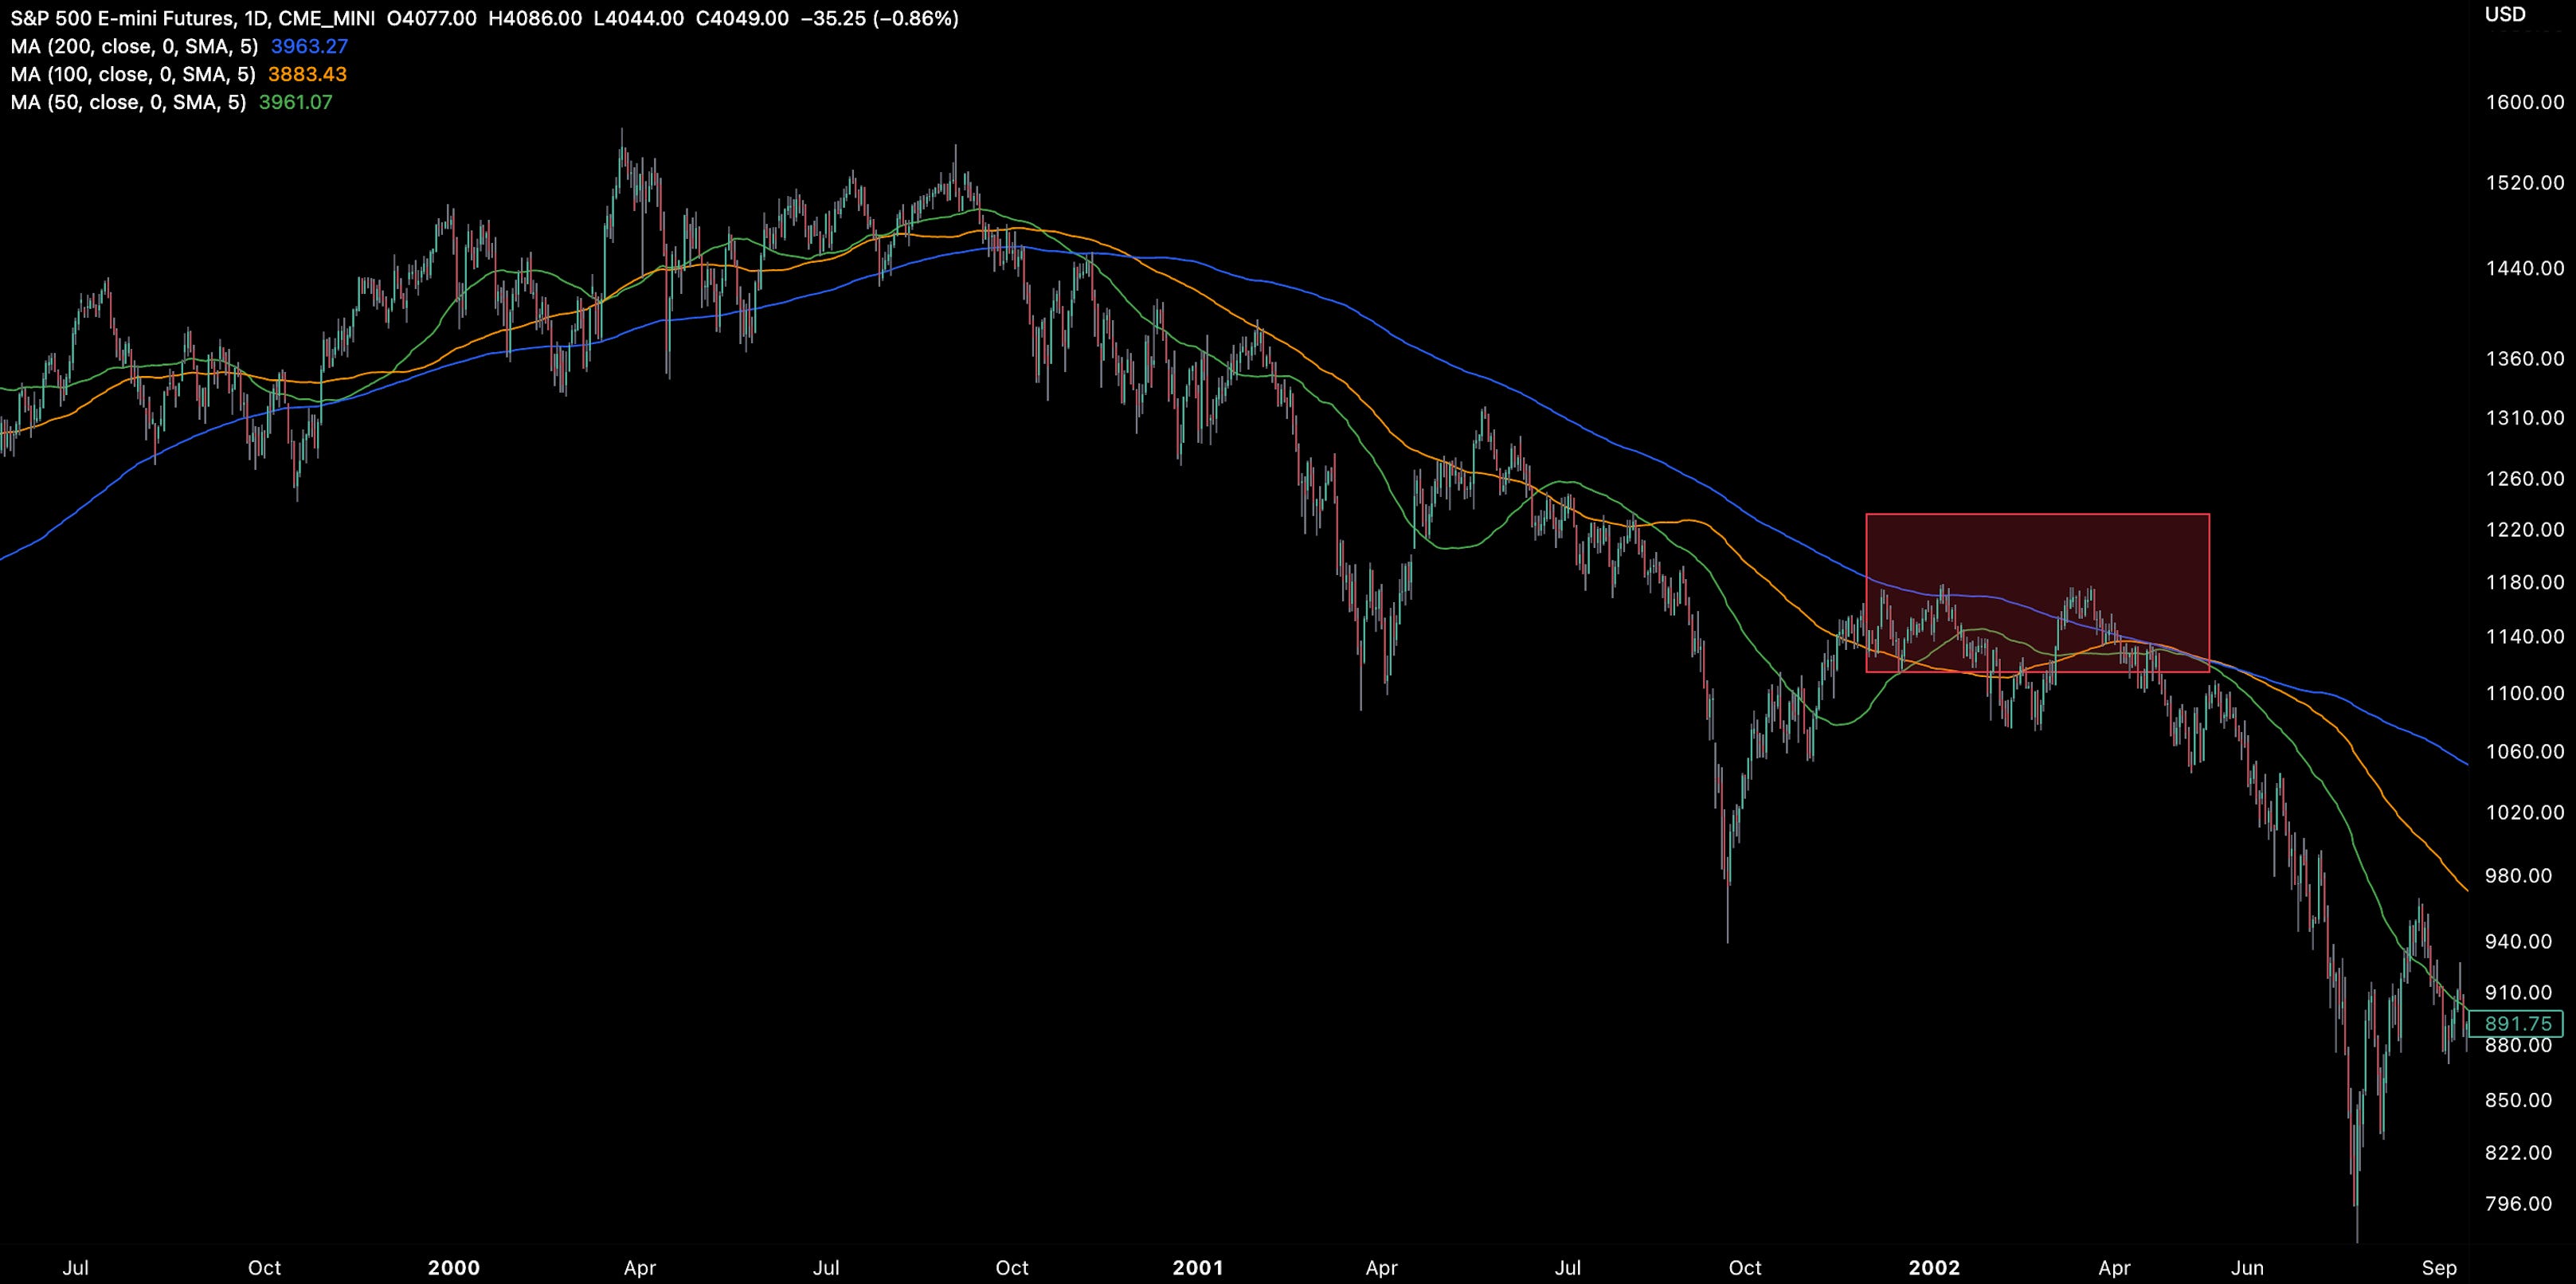
The resulting price pattern may be akin to March 2002 where the S&P 500 recovered above prior momentum only to resume its downtrend at an accelerated pace.
In a similar tone, Morgan Stanley’s Michael Wilson stated:
“The recent run up is reflection of seasonal January effect and short covering after a tough end to December and a brutal year.”
In other words, as the loosening of financial conditions aid risk asset recovery, the possible of a bad earnings recession means valuations are becoming too hot relative to the reality. The Fed’s inability to pivot into a more dovish stance is what will eat into investor optimism.
Regardless of the broader direction, relative plays around BTC have rewarded traders despite the overall choppy market. Bitcoin dominance edges higher to 45% but still 2% from its historical top after bouncing from its 39-40% lows. Further relative upside performance for the orange coin looks in play for the days ahead.

Unlike Ethereum, Bitcoin has its halving countdown where the number of BTC rewards will be cut 50% from 6.25 BTC to 3.125 BTC ~March 2024.
We are now ~68% of the way through the current halving cycle which has historically (sample size = 2) marked more constructive periods for BTC prices as the market positions more strongly around the hard money narrative.
At this stage, it’s unclear if BTC has the macro tailwinds this time round. The Fed tapering its rate hikes may be taken as headwind for dollar (currently a crowded trade) but the duration of high rates may be what matters for Bitcoin.
In other words, the halving narrative may ultimately stem from whether we see a hard(ish) landing that warrants loosening of conditions by the Fed. However, if we see that outcome, all cryptoassets are likely to benefit and so the halving’s narrative catalyst is less Bitcoin-specific and arguably more generalized.

Bitcoin isn’t without its challenges either. Bitcoin hashprice is now ticking higher once again as a result of new all-time-highs in hash rate (294m TH/s) vs. a consolidating BTC ticker.
The doubling down of miner resources means there is growing pressure for prices to increase from current levels. This comes as the mining difficulty climbs new highs (+4.68%).
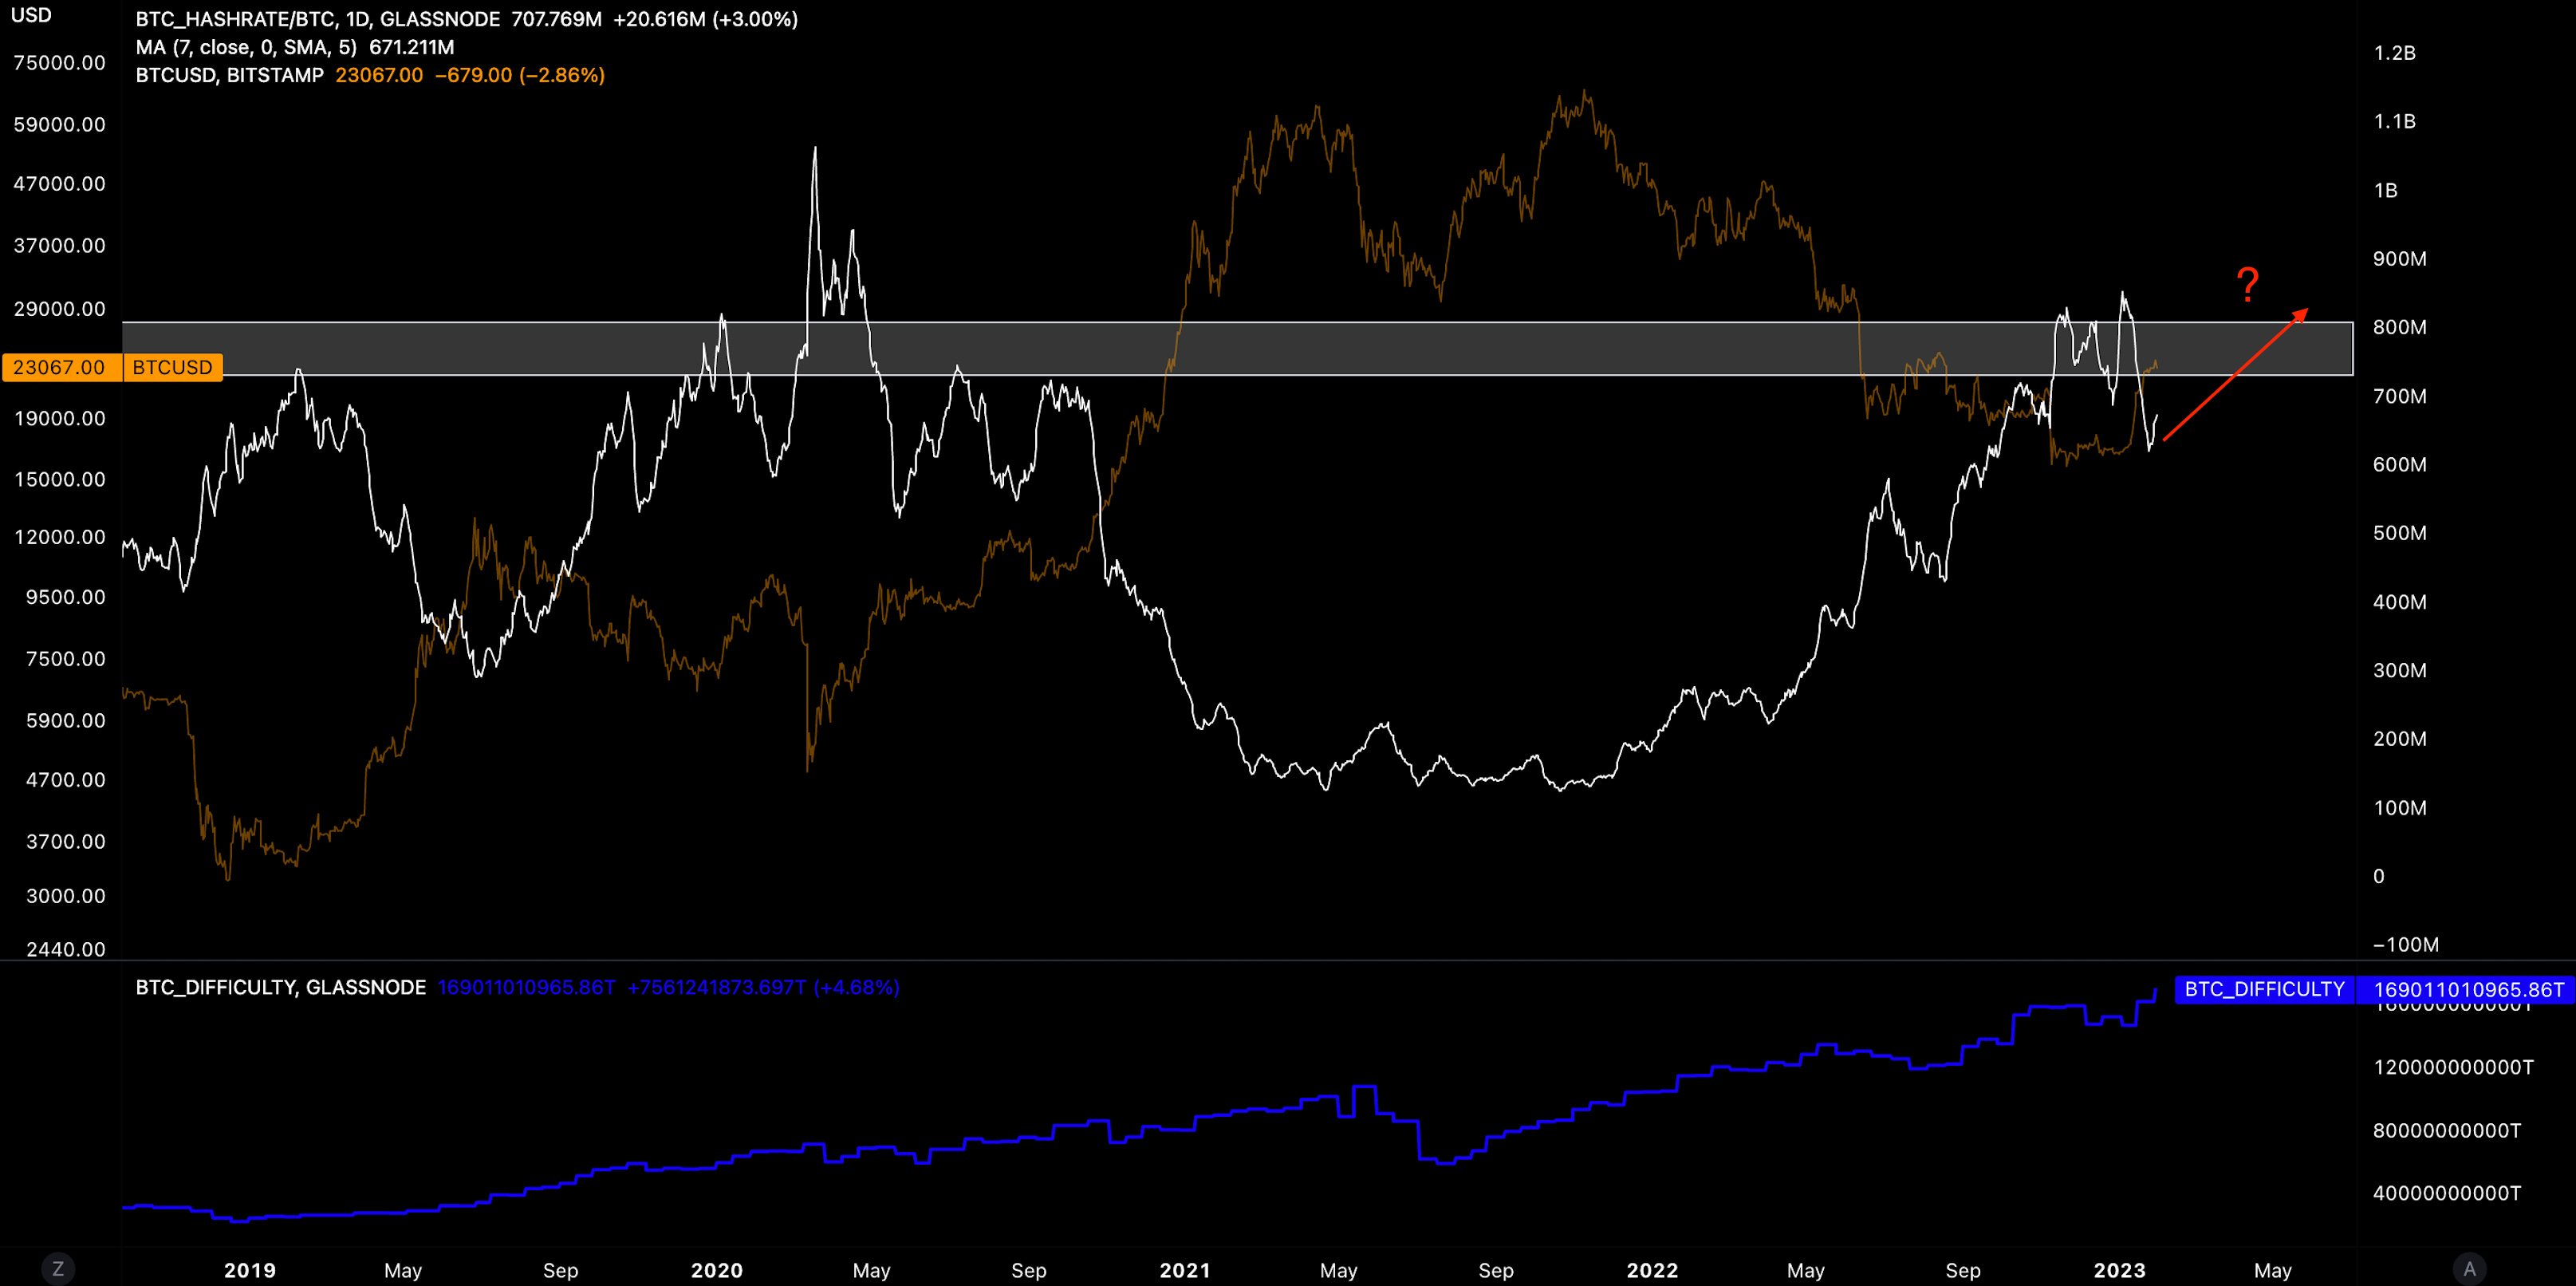
Bitcoin average mining cost is $21,176 or 8% below current prices. Average mining costs can act as initial support for BTC/USD with the theory being that Bitcoin should trade at a lower bound fair value at the current cost of production (although the cost can decrease/increase).

Volatility within the crypto market continues to be driven largely by the futures market where shorts have double down despite their losing streak.
Aptos, which has lead the market over the past week (+39%), saw $25m in total short liquidations last Wednesday sending APT to new all-time-highs of $19.92. Funding rates are now becoming neutralized over the past week. A resumption of extreme negative funding may heighten risk for further upside swings for the bears.
APT’s total short liquidations have been outpacing ETH’s over the past week. This comes as APT’s trading volume is only ~12% that of ETH’s.

We can also see that fundamentals have not played a part in price moves where daily, weekly, and monthly active users on Aptos have been steadily falling since November 2021.

Other high-beta plays on ETH also appears overvalued once again. Consensus plays like LDO leading into Ethereum’s Shanghai upgrade have been top performers YTD (+140%) with staking infra/scaling being the top themes for Q1-Q2 23.
LDO/ETH has reached its multi-year resistance zone (blue) while we see LDO/USD printing yet another lower peak as confirming a continuation of the same old wedge price pattern.
Despite our recognition that many cryptoassets are in deep value territory, our conviction of a true bullish break out will strengthen when we see clearer signs that alt assets are breaking their previous two-year momentum history.

The DeFi/ETH has also failed to re-take its 200d MA or make higher highs. The sector’s ability to climb above the 26% mark has been challenge since August 2022.

Select assets diverging from the broader market like MATIC (+13%) have been driven by news headlines surrounding protocol upgrades. Polygon’s upcoming zkEVM mainnet launch is now being priced in where the network will be able to scale and integrate more closely with Ethereum L1.


Decentral Park Market Pulse

Want real time updates and analysis on the digital asset market? Join Decentral Park’s Market Pulse group by clicking the link below:
Global Market Cap

$1T; Consolidation around the $1T mark which has proven to be a sticking point for traders. Divergence in RSI may mean weakness might ensue / market’s ability to break above the $1T might be challenging.
DeFi MCAP

$415.6; DeFi likely heading to correction territory as RSI divergences indicate. Weakness starting with the sector declining 4% on Monday. DeFi continues to underperform against ETH.
Trader Positioning
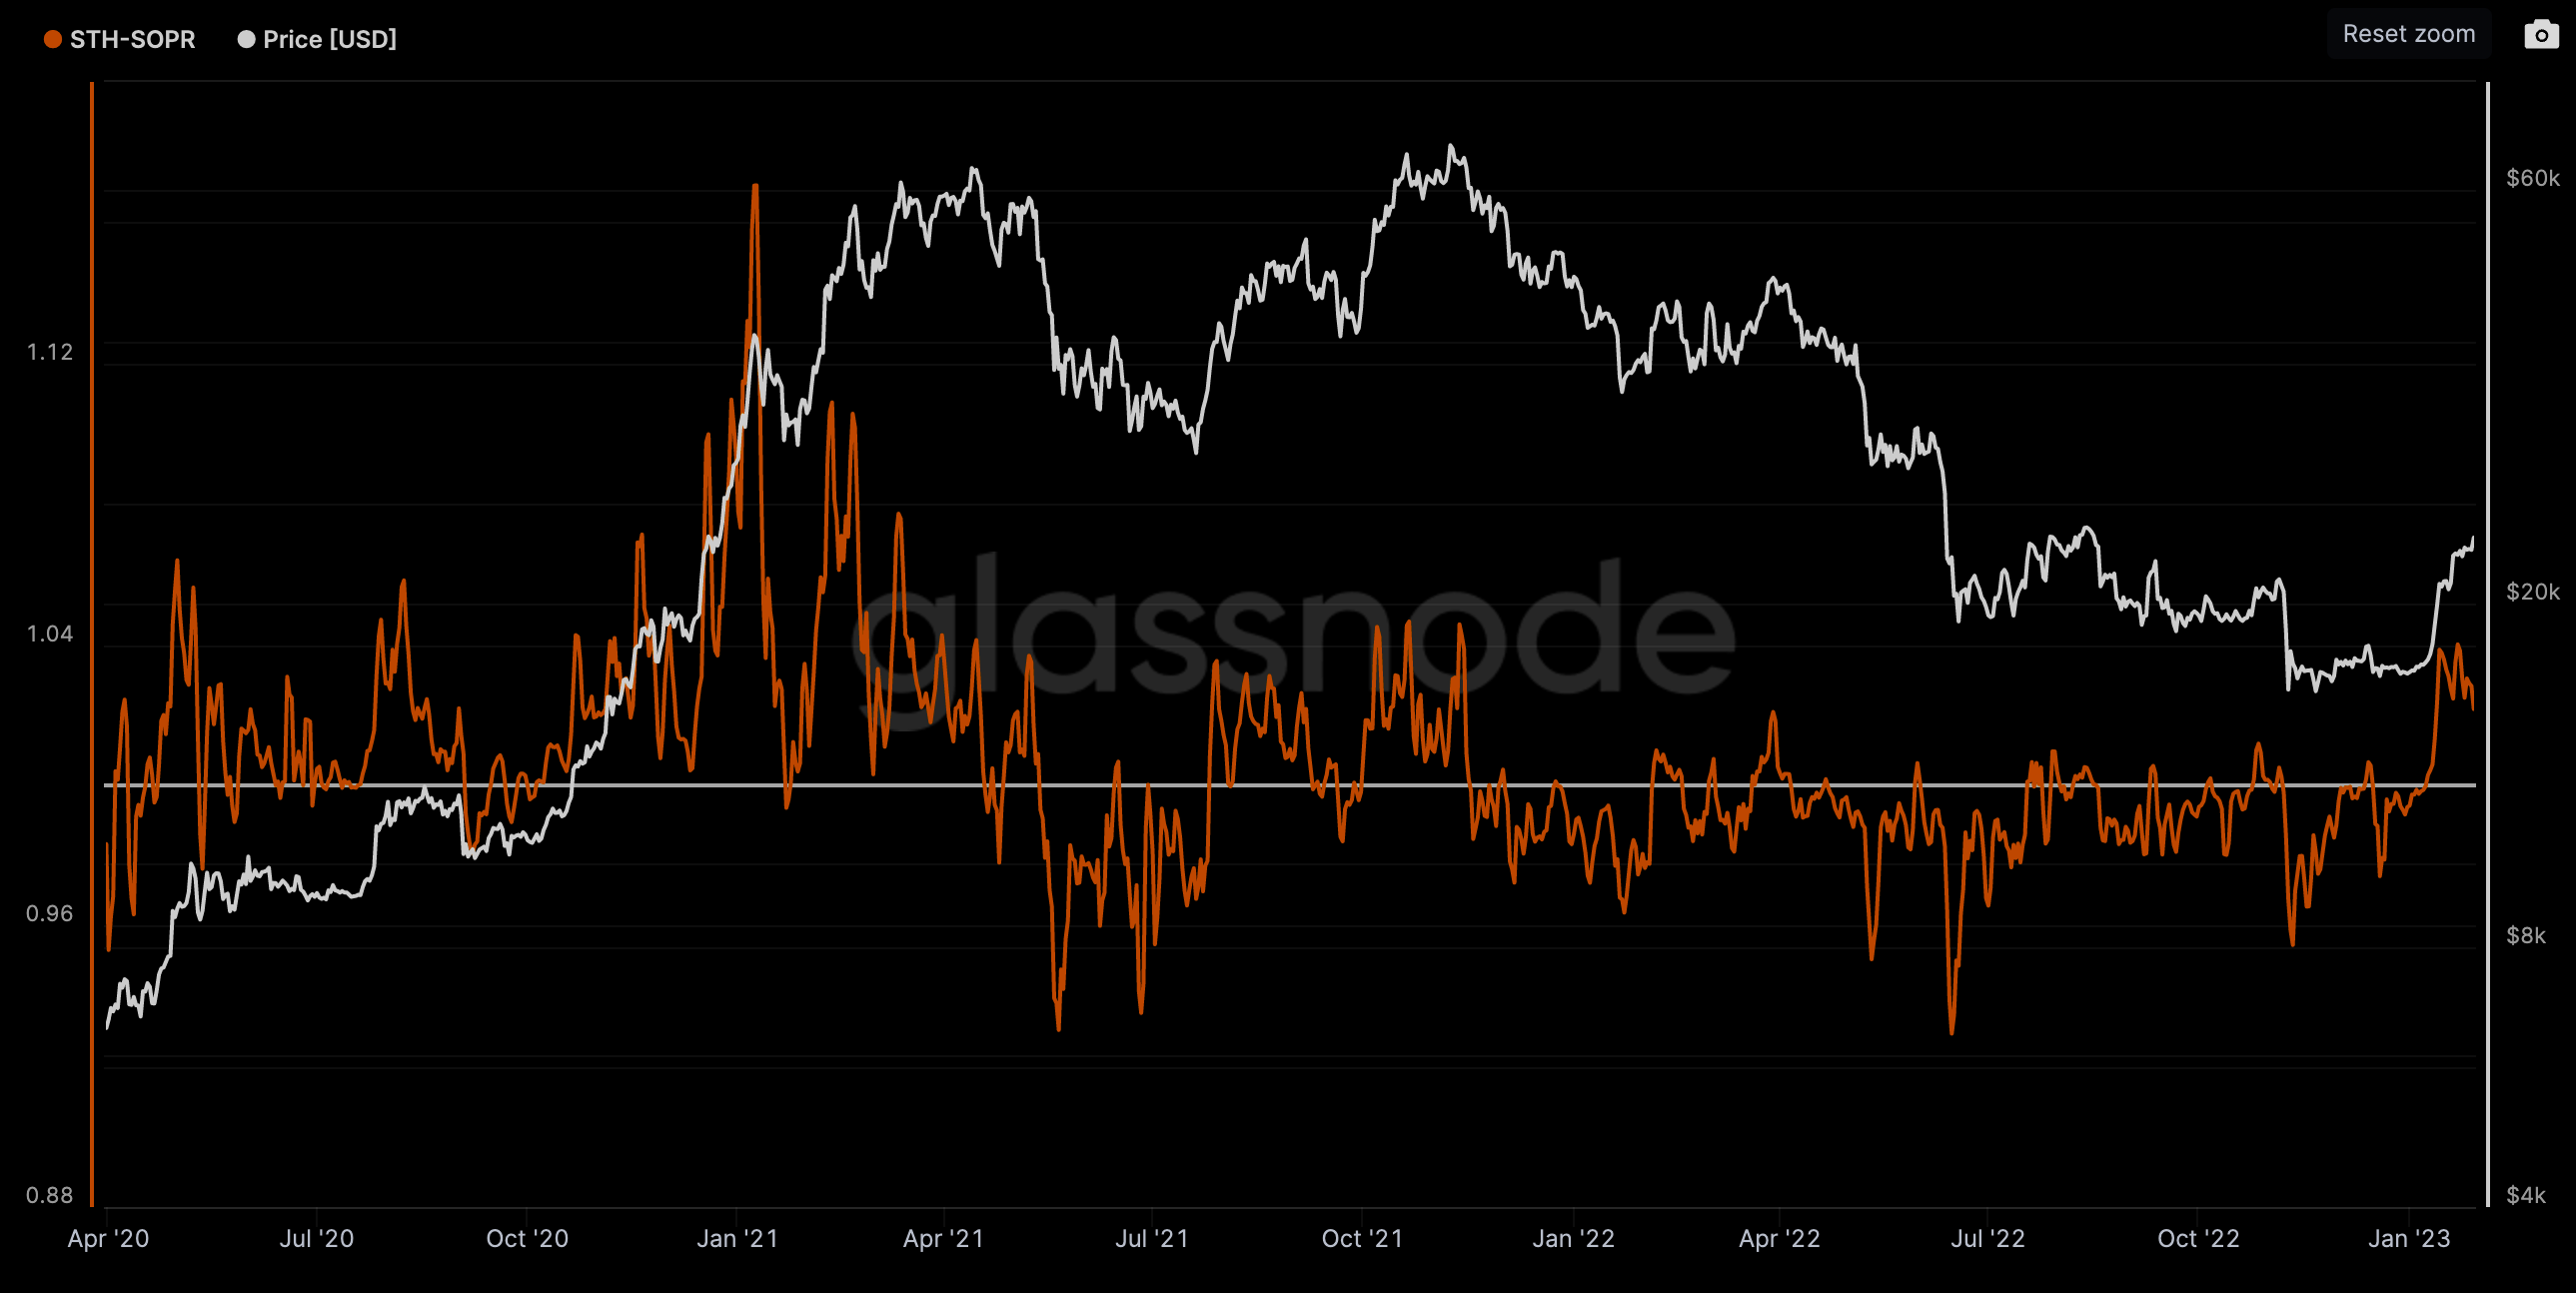
Short-term traders have been realizing profits over the past few weeks but STH-SOPR is trending lower towards 1 meaning short-term holders are realizing their coins when markets are becoming less profitable. Watch for bounce/break below 1 in coming weeks.
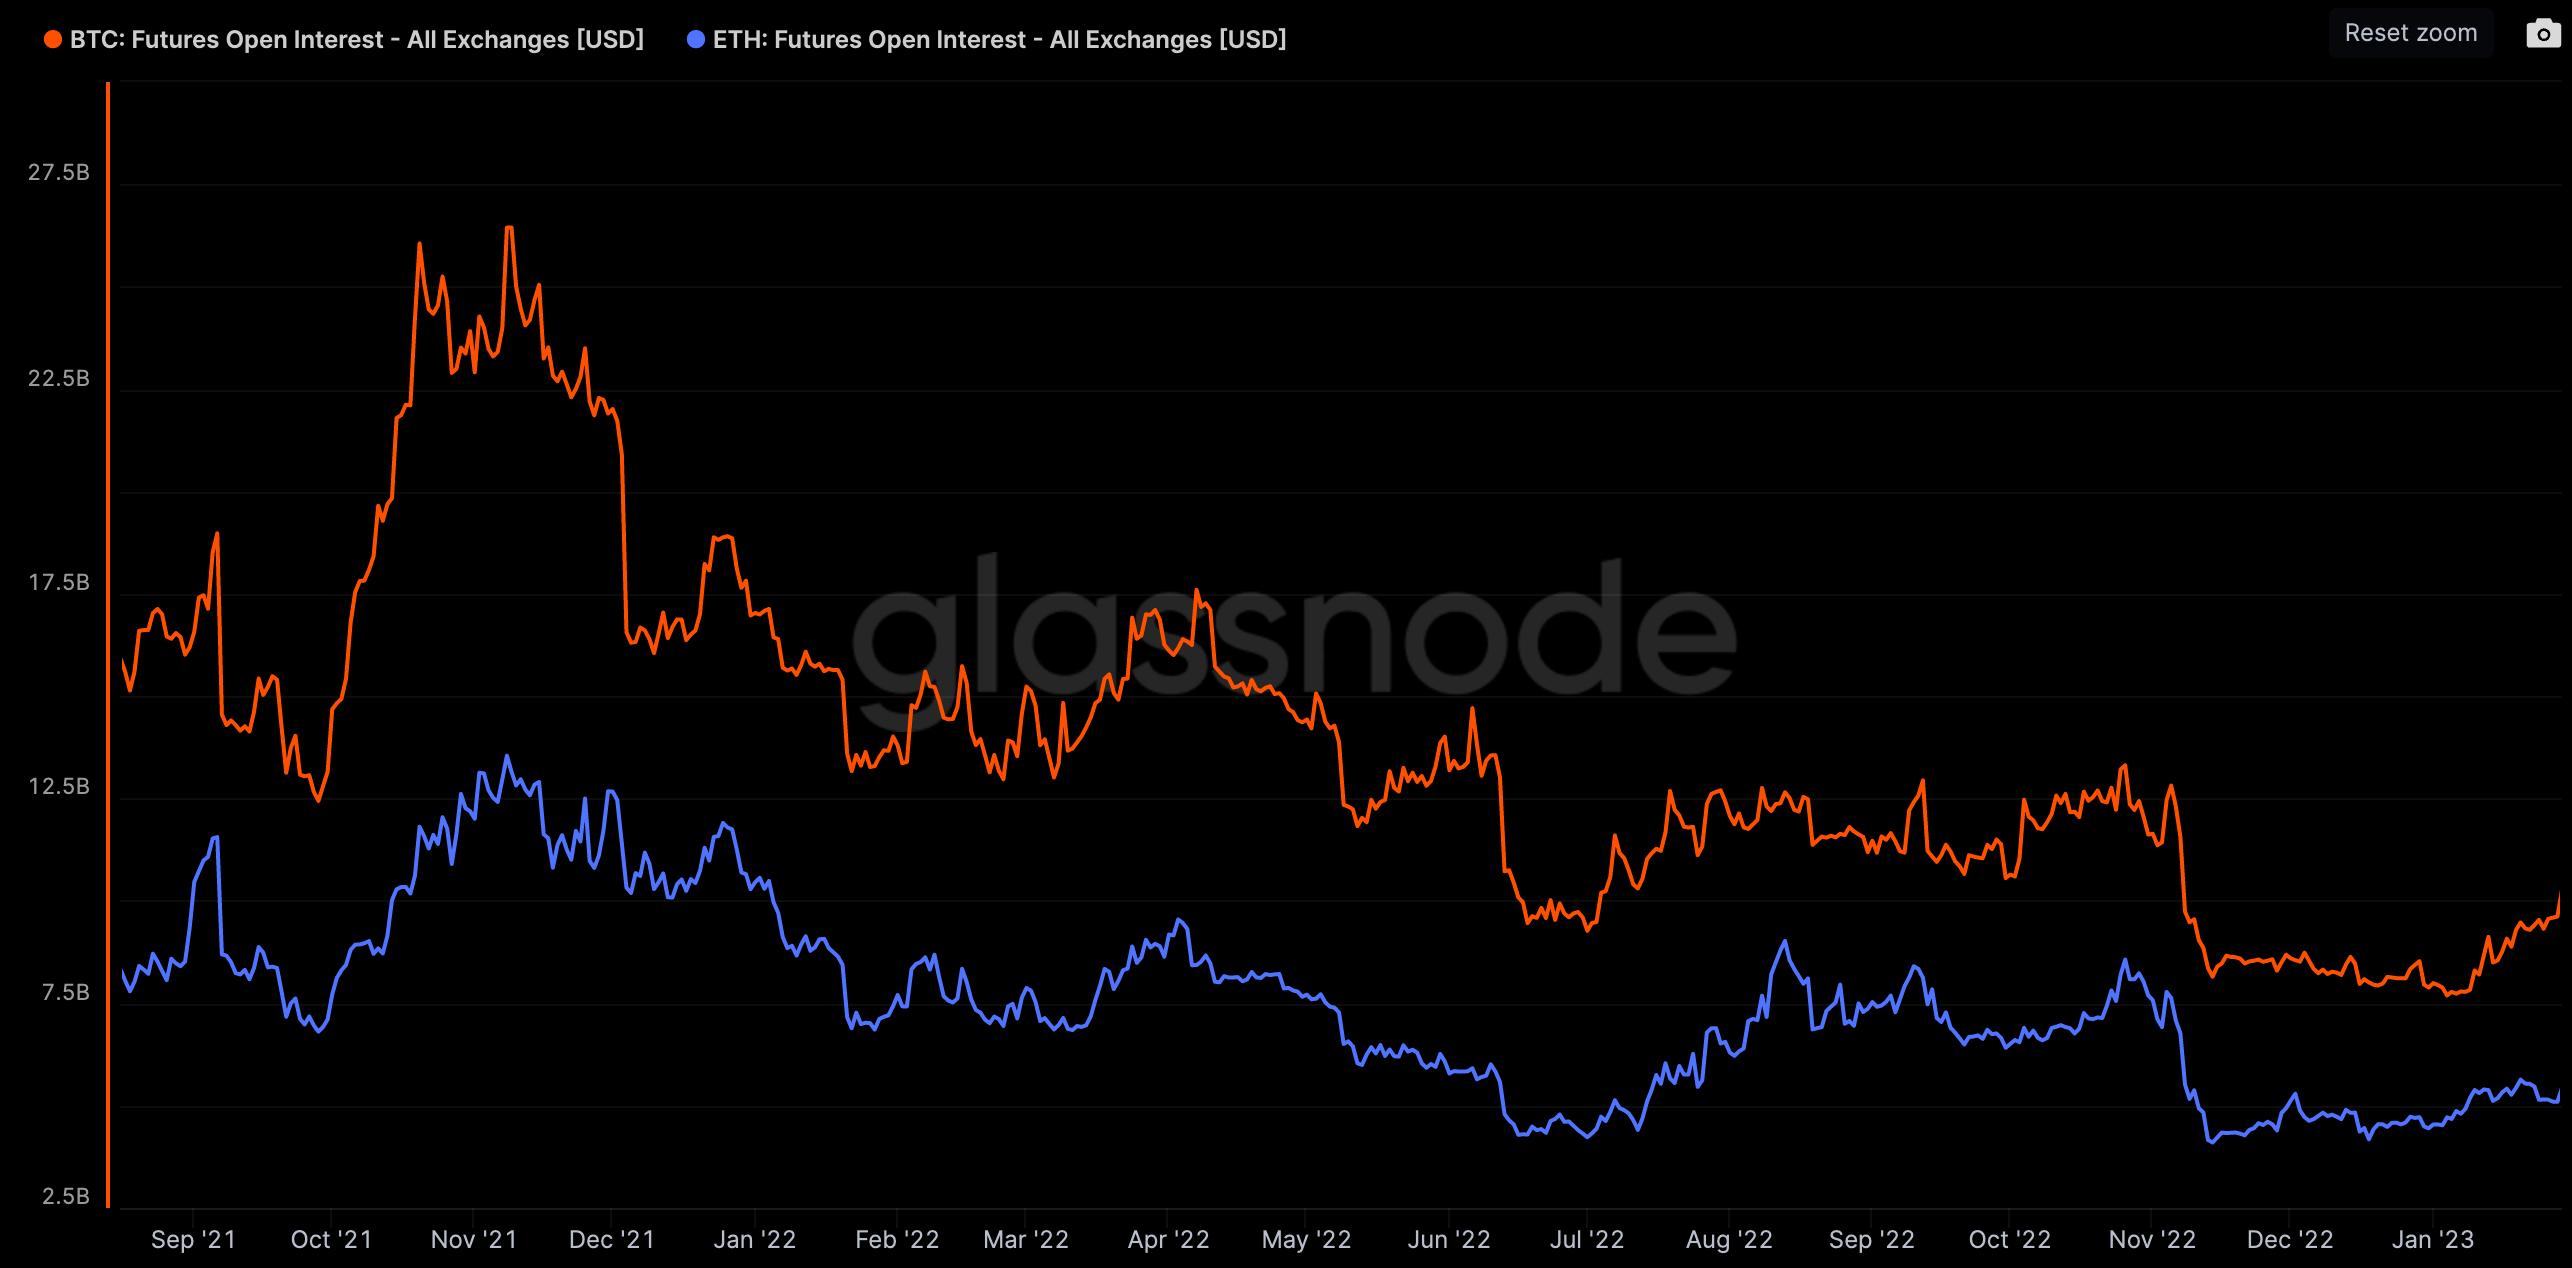
Bitcoin futures OI has increased 50% YTD to $10.2B while ETH futures has gained 20% to $5.4B.
CME futures OI for Bitcoin reached new highs not seen since April 2022 ($2.25B) with CME’s OI dominance also climbing to new ATHs (21%). The growth in OI/dominance is likely driven by hedged GBTC long positions that capitalised on the discount and supported by strong market performance in January.
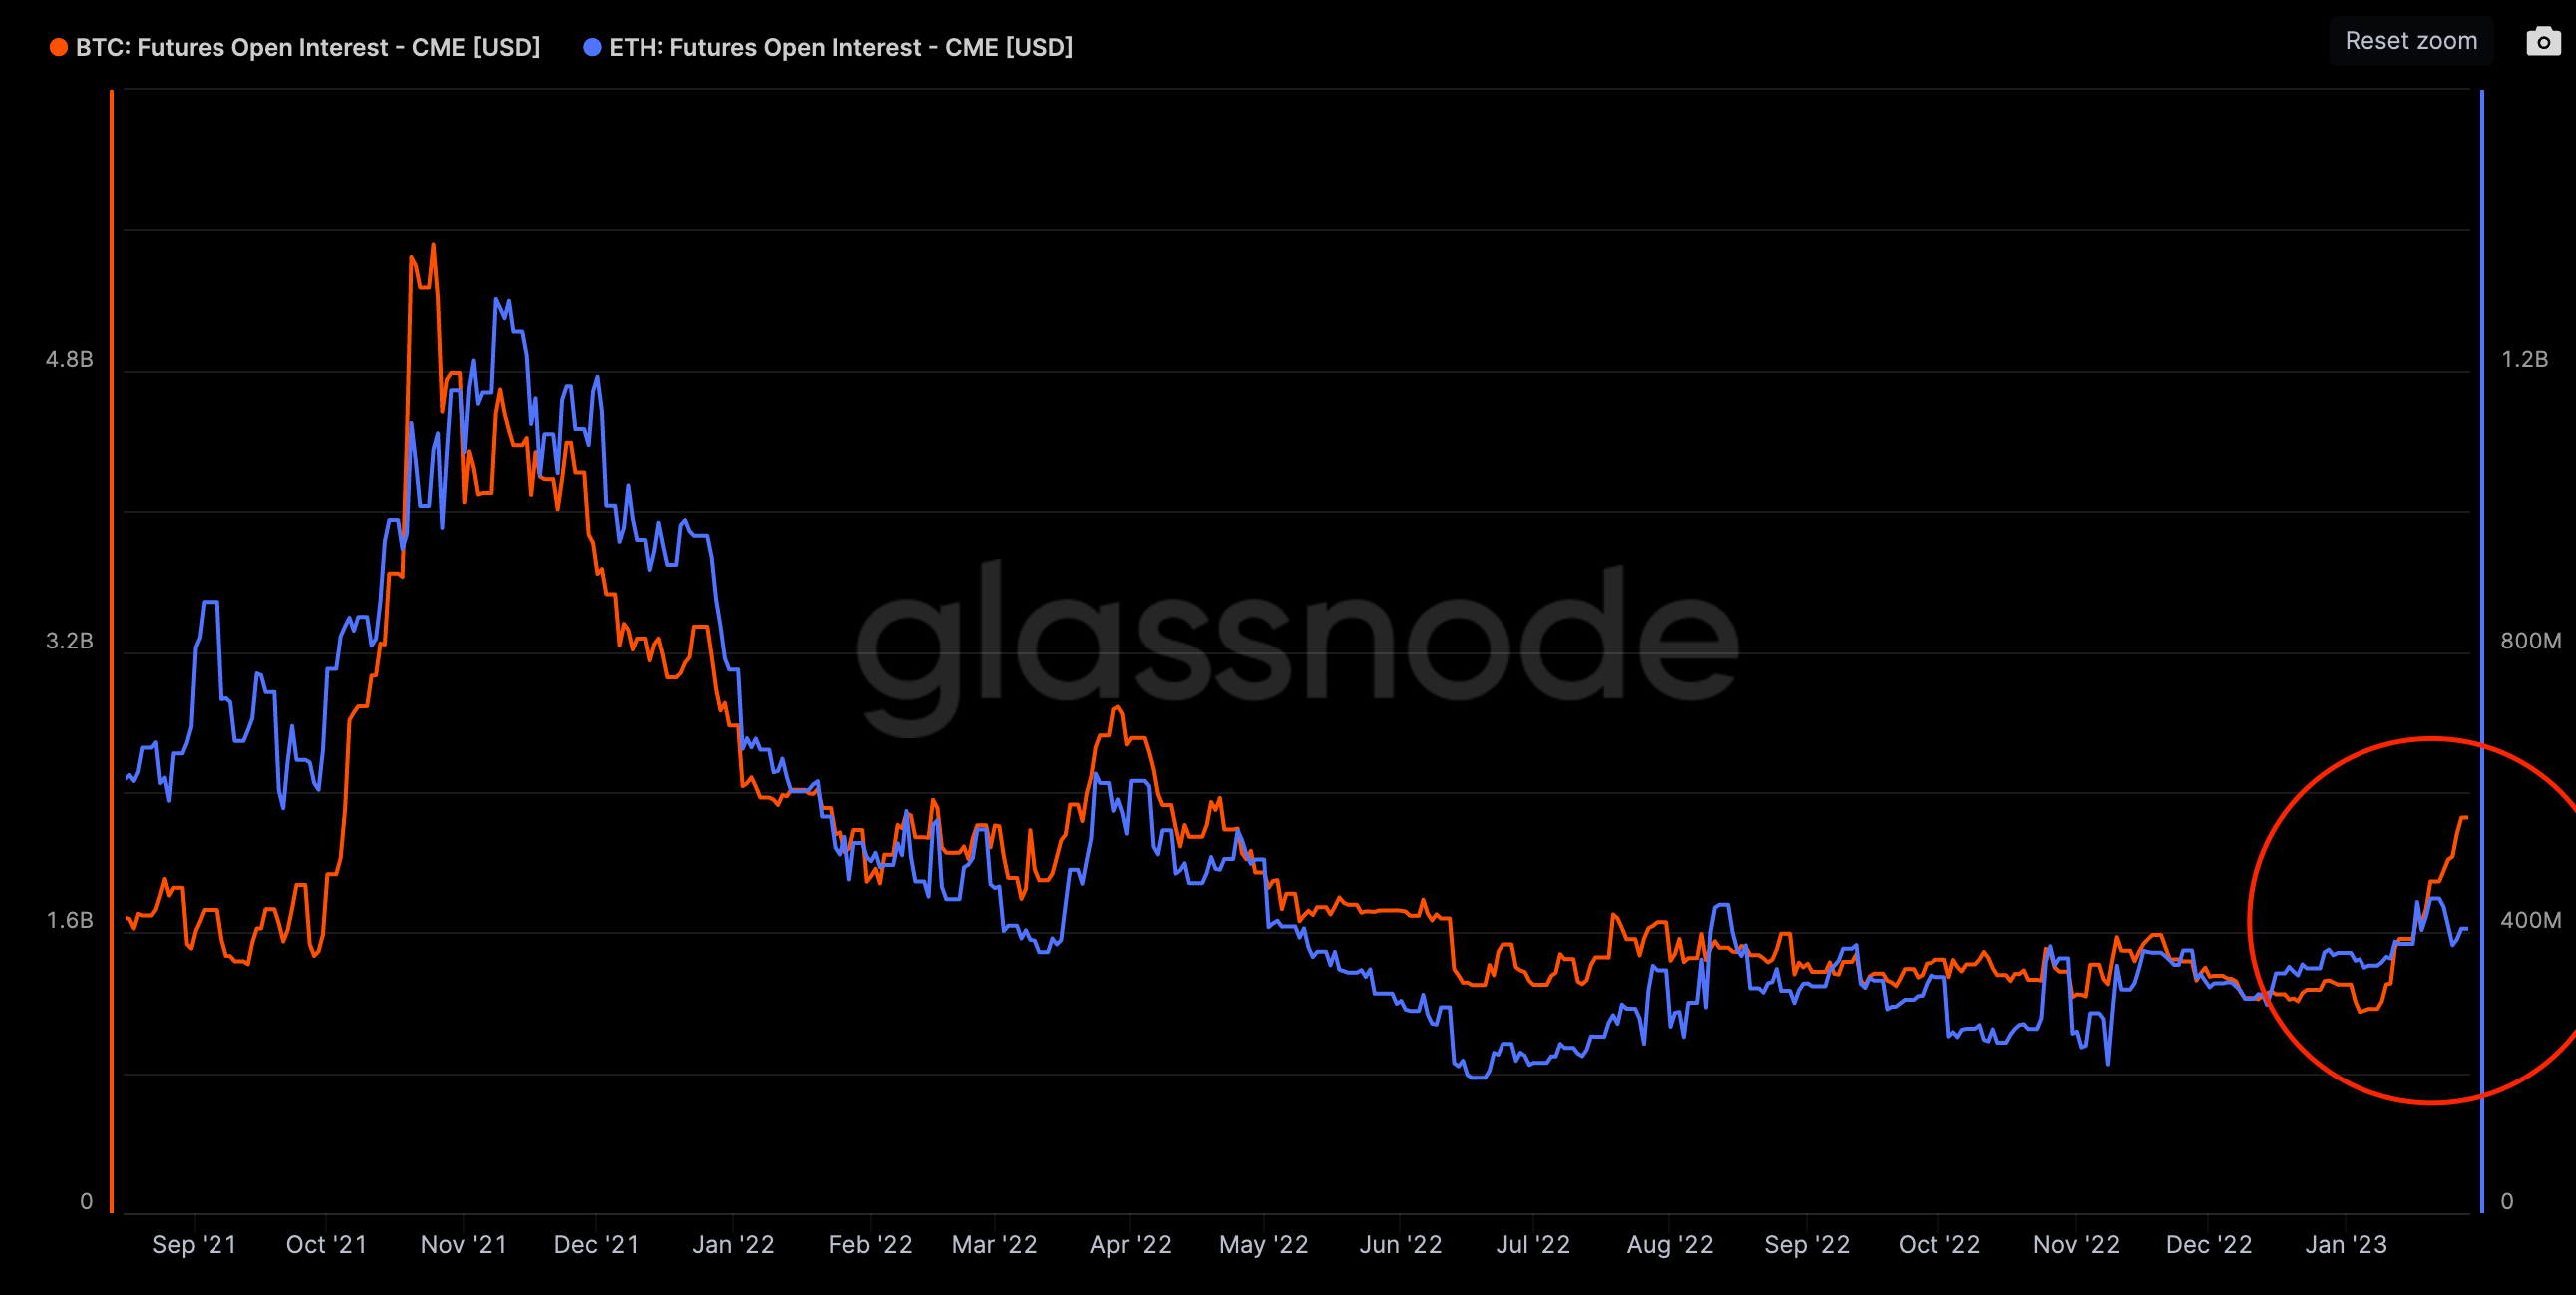
Funding rates indicate traders are taking a predominantly bullish stance and maintain conviction in January’s positive price action.

Grayscale Trusts
GBTC
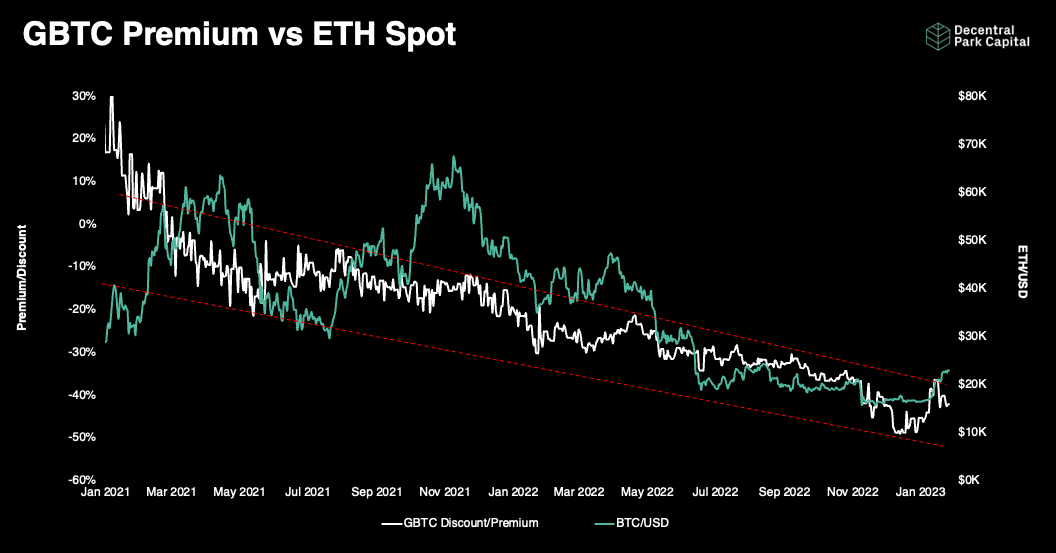
GBTC’s discount to NAV kept relatively flat over the past week standing at 42%.
ETHE

ETHE’s discount to NAV widening to 50% over the past week (from 47%). ETHE’s discount is likely widening at a faster pace than GBTC due to the relative outperformance of BTC vs. ETH since mid-January.
Aggregate Order Books

Order books look slightly heavier on the ask side. Heavy resistance all the way up to $25k.

Top performing assets in the market have largely been driven by futures dynamics. APT has seen $5-6m consistent short liquidations over the past week.
Top 100 (7d %):
Mina Protocol (+43.5%)
Aptos (+35.1%)
Radix (+33.4%)
Loopring (+22.3%)
Fantom (+21.4%)
DeFi Top 100 MCAPs (7d %):
Keep Network (+89.0%)
Injective (+42.1%)
dYdX (+41.3%)
Loopring (+22.1%)
Covalent (+22.9%)
> On Improving Self Custody with Account Abstraction [On The Brink]
> What’s Next for NFTs? [The Breakdown]
> The Rise of Decentralized Social Networks [Bankless]
> Bear Market: Stage 3 is upon us [Empire]
> How Congress is warming up to crypto [The Scoop]
> Ethereum functional model [Jon Charbonneau]
> The Year Ahead [Pantera]
> The Best Tool for Designing Effective DeFi Policies Is Web3 Itself [Coindesk]
> Secret Labs and Secret Foundation battle it out openly [The Block]
> Trading Momentum Swings [Hal Press]
The information above does not constitute an offer to sell digital assets or a solicitation of an offer to buy digital assets. None of the information here is a recommendation to invest in any securities.