


Join the 1000’s of founders, investors, crypto funds, brokerage firms, and developers in getting free cutting edge crypto research by subscribing below:
Run Rudolph Run
Crypto markets may now be seeing the lift investors have wanted for a while.
Total market capitalisation is now standing at $824B, trending close to resistance of ~$830B.
But don’t get ahead of yourself. Markets have a long way to go still. From a technical perspective, MCAP would need to use $830B as new support with the higher conviction signal being a break above its 200d MA - a zone often been used as resistance for investors during the current bear market. Note, this has also been the case for $SPX too.
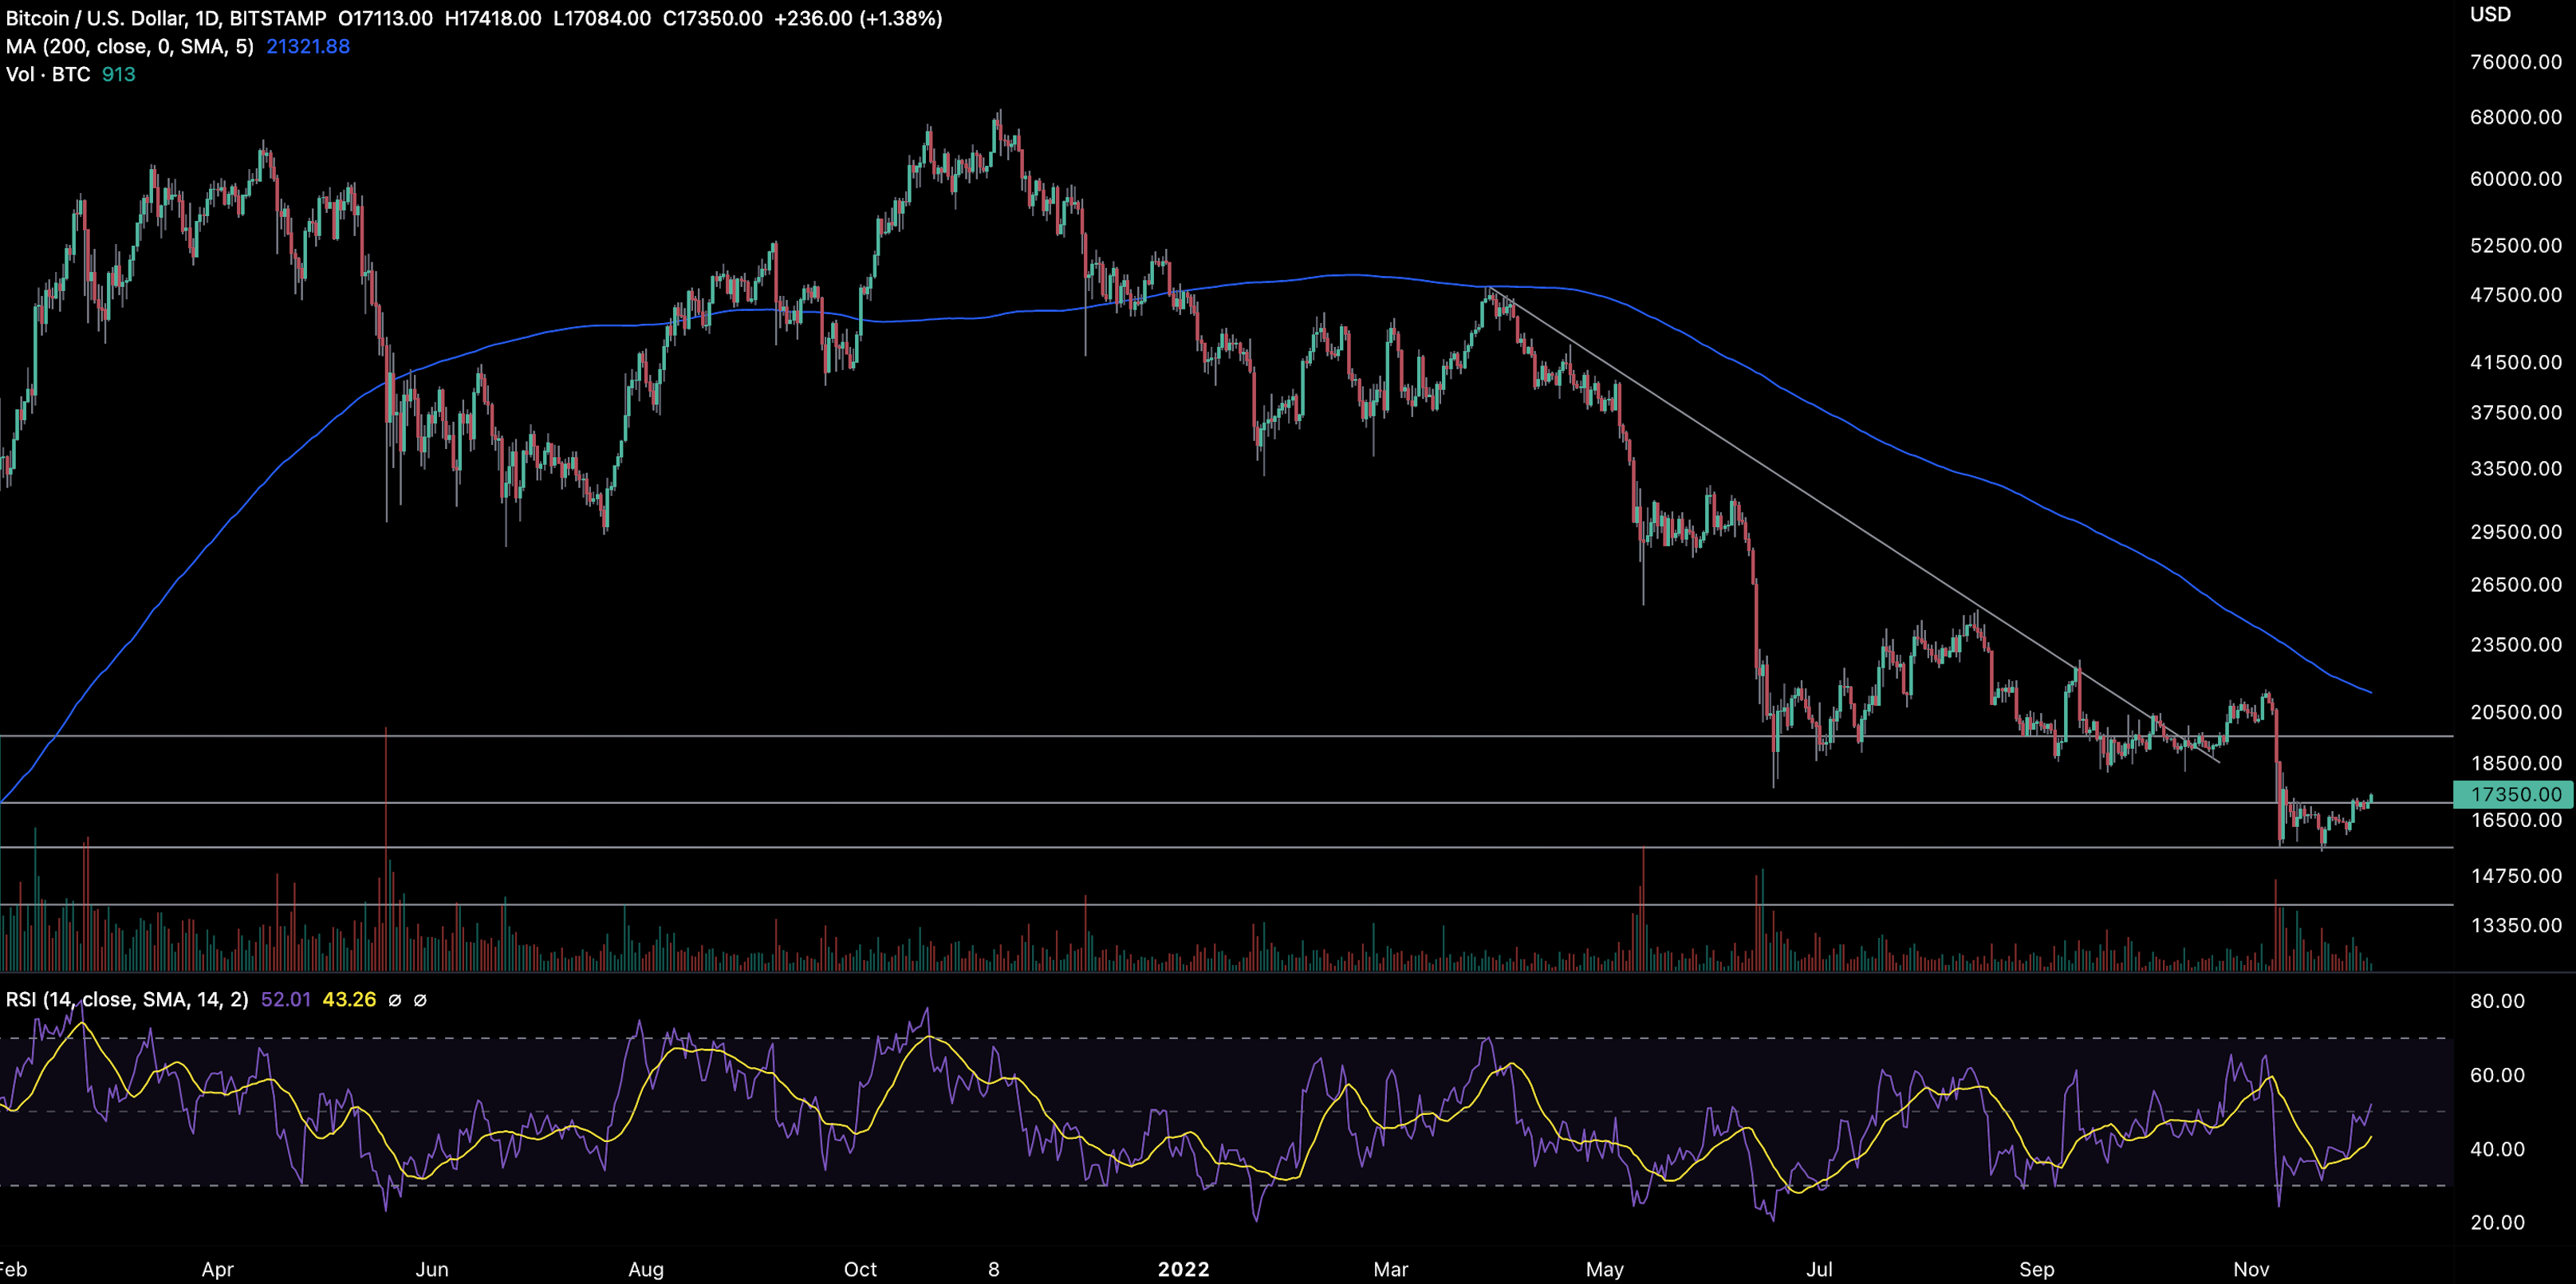
As we highlighted in previous editions of The Weekly, daily RSI was posting a bullish divergence and the current push higher may be the result of that signal being realized.

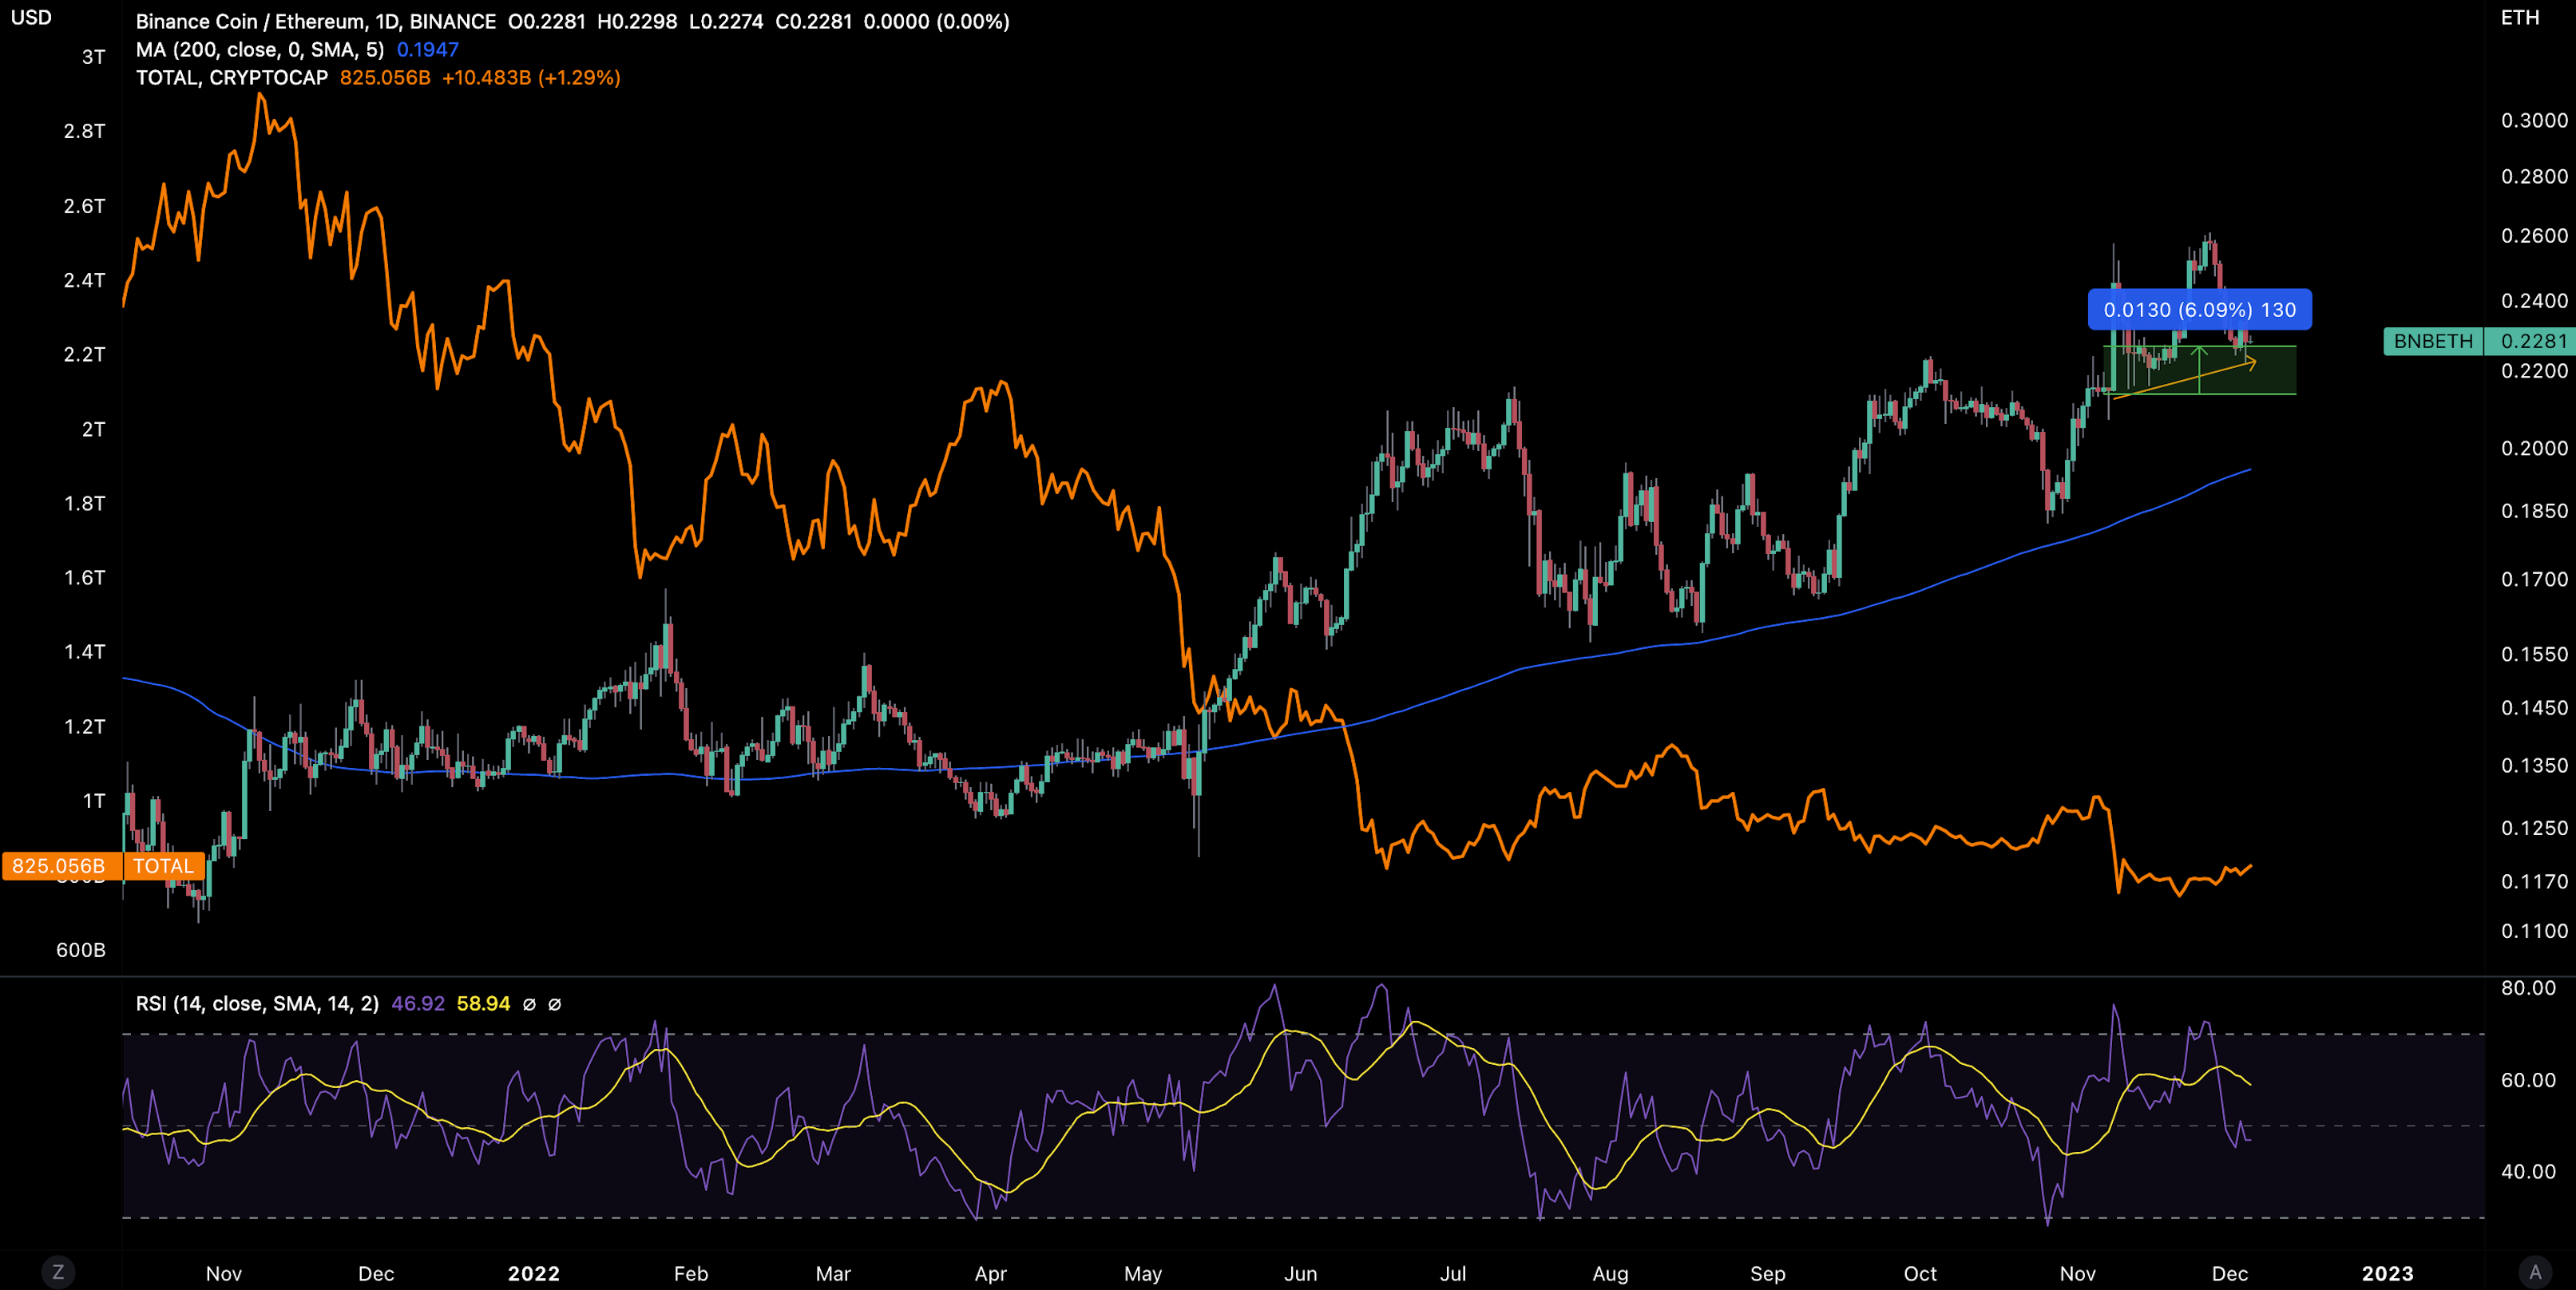
BTC has now broken above its $17k ($17,350) and is the highest print since the 11th of November. For the orange coin, the next possible zone of resistance is ~$18.5k with the higher conviction signal also being a break above its 200d MA.
The recent moves higher have also led ETH to outperform its BTC counterpart but not by too much - 0.13% on Monday and 2.9% over last week. This may be a reason to be cautious for now as higher conviction moves in the market would likely translate to more of a divergence between the two assets. In other words, it feels like the market is still finding its feet.
Next resistance zone ~0.076771.

Looking at the broader market, a few things are worth noting:
Names like BTC and ETH are printing good performance while also being the most liquid and highest MCAP. These may be the ‘obvious’ choice for allocators looking to put chips back on the table
Layer 1 blockchains like Dogecoin, Litecoin, and Shiba Inu are outperforming the high MCAP names indicating retail or highly speculative money is still present in the market
Higher cap DeFi names are also printing good performance but still sluggish once adjusted for their liquidity
For the top performer, Axie Infinity (+24%), there is no obvious driver in performance. Even stranger, on-chain analysis has shown continued decline for the ecosystem in the last few months.
Given point 2 and 4, it still appears mercenary and less smart money is still moving markets. This has been the case for some time and hasn’t gone away. The implication being a more skeptical view on these market rallies being sustainable.

Previous high movers like LINK looks to have topped out ($6.2) prior to Staking v0.1 release on the 6th December in what appears to be a classic buy-the-rumour-sell-the-news set up.

Elsewhere, there are possible hopes for those assets hit hardest by the FTX drama. SOL’s drawdown is now comparable to ETH’s during 2018 - falling 95% from its ATH levels.
Through this lens, SOL’s next upper range price target would be ~$50 (+350%) which also marks the asset’s summer resistance level.
Alameda’s 13.5% control of SOL’s circulating supply is a market risk overhang for investors but practical means little in the nearer-term. Alameda’s SOL is locked for the next 3-7 years while FTX’s SOL is locked within the exchange’s current bankruptcy proceedings.

A relief rally may not be on Santa’s list
When it comes to the potential direction for cryptoassets until YE, the macro may still play a role despite the relationship between equities and crypto breaking down recently.
The 20d rolling correlation between the S&P 500 and total MCAP has reached yearly lows. The explanation is simple:
$SPX has gained ~16% in less than 2 months to trade slightly above its 200d MA for the first time since April this year. Investors were positioning around slower growth leading to rate hike pace deceleration. Now
Meanwhile, crypto has has the overhang risk of FTX contagion and fallout. With an expectation of mean reversal in correlation, both are likely to move in tandem once again but the direction may still be skewed negative.

Equity markets may be too overcooked. The 200d MA zone was the resistance zone for investors during the 2000-2003 period. This comes as BoA suggested a sell for equities before 2023 unemployment shock became a reality.
Now Michael Wilson from Morgan Stanley has joined that call. High conviction calls on equities are starting to fade.
After all, US unemployment rate at 3.7% signals the labor market has remained strong even if it is a lagging indicator. VIX was also printing sub 20 as investors shredded any fear. A reversal in the VIX may signal bearish for risk assets.
The markets still have plenty of macroeconomic data and speeches to digest until year end - CPI, PCE, and FOMC.

On this note, if recession lands in 2023 (where unemployment needs to spike up), SPX would head towards 3200-3000 - a possible further 26% decline from current levels.
However, if no recession where growth remains positive against falling inflation then equities may have bottomed already in October. The 2-10Y curve remains strongly inverted (and becoming more inverted) suggesting the former is to play out in force next year.

Coming full circle, crypto is still facing an uphill battle.
Growth stocks and NASDAQ have often led broader markets post cycle bottoms.
For this current equity rally, growth stocks and NASDAQ has actually lagged their other index/sector counterparts (see last week where we analysed how Fed net liquidity drove performance in DJI vs. NASDAQ). Crypto will likely move in tandem with growth stock given their shared characteristics.
Therefore, it becomes hard to know who will allocate in size to crypto if allocating to growth stocks becomes challenging for those same investors in a 23 recession scenario.
Therefore, you have to take these recent crypto rallies with a high level of caution. At the same time, these are clearer deep value opportunities for those long-term investors that can stomach the week-to-week vol.
Speaking of vol, BTC’s 7D BHVI is still <30 indicated a higher level of price compression that may preceded a more significant move.

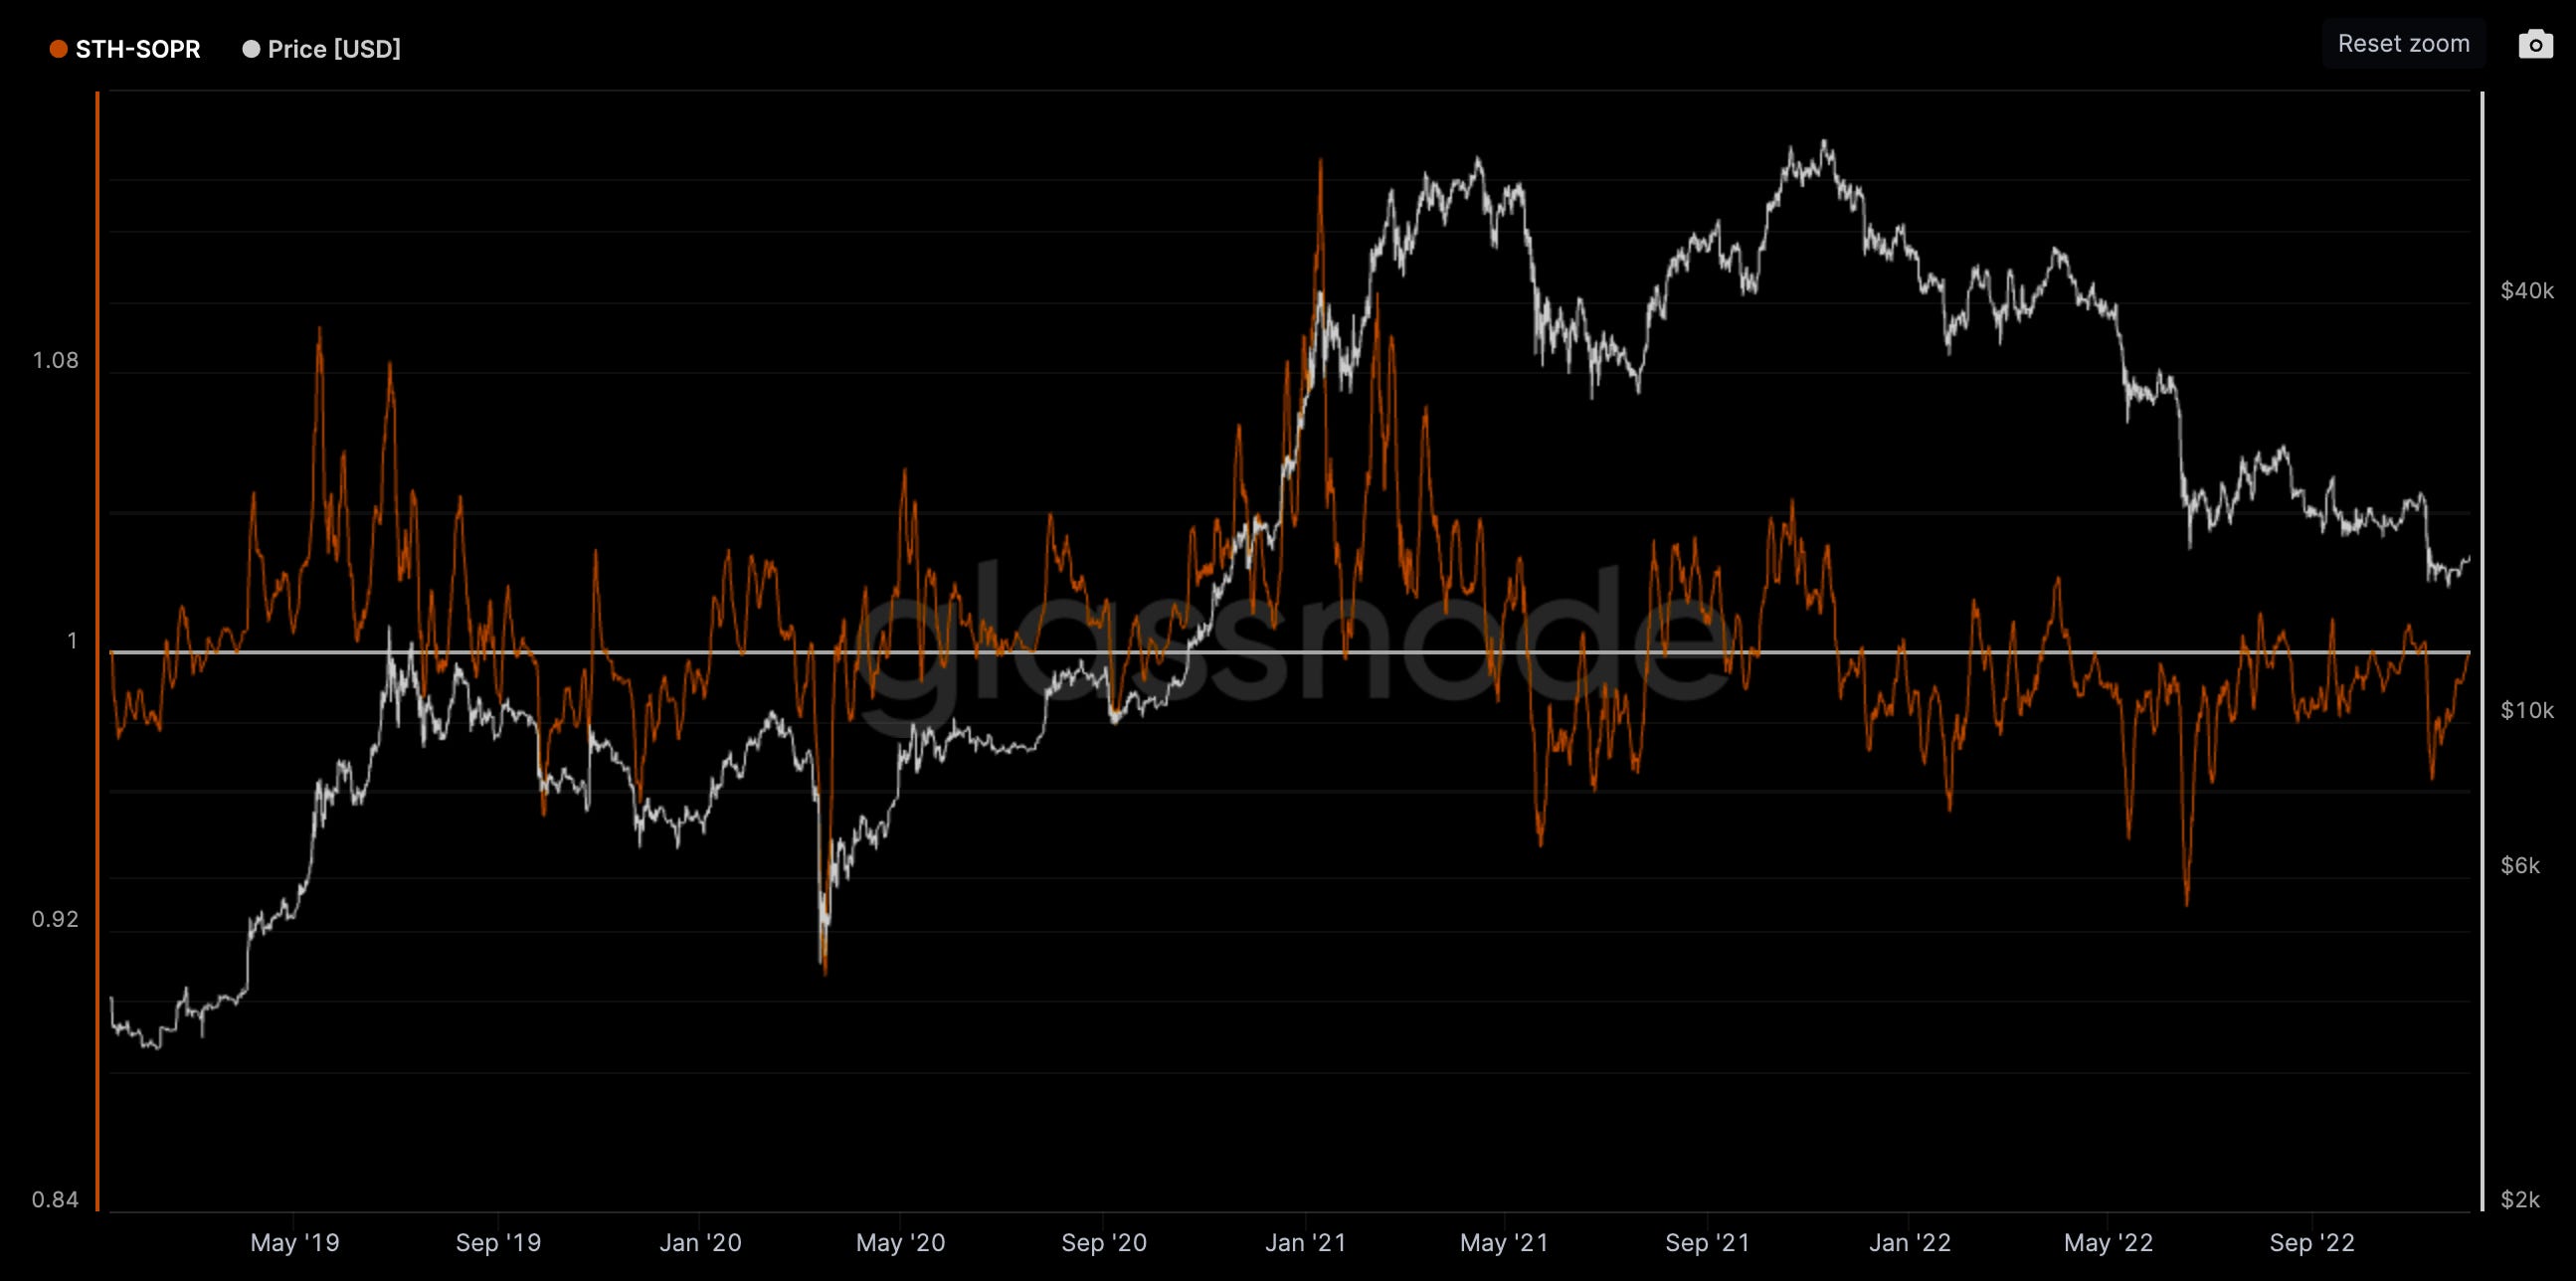
On-chain indicators like STH-SOPR, which assess the behaviour of short-term investors, will be key to determine the levels of mercenary capital within the markets.
BTC’s SOPR needs to find support above 1 to signal that investors are not just exiting their position close to cost basis during every rally.
In other words, using 1 as new support would indicate a more constructive market where trading conditions are becoming more profitable/less likely to sell to recoup losses.
Other measures around economic activity for the Bitcoin network are positive. 30D active address trends has been finding good support since 2019 and is positive for a Metcalfe’s law approach to BTC’s valuation.

Bitcoin addresses has also bee outstripping Ethereum’s since ~Q2 2021. However, the ETH/BTC price ratio paints a different picture gaining 108% since the fall in ETH/BTC DAAs.

It is likely the market is pricing in Ethereum’s economic activity (or density) via other networks like layer 2s (e.g. Optimism, Arbitrum). We can see that both L2 DAAs and L2 TVL took off right around the time of ETH/BTC price breaking new highs (Jan 2021).
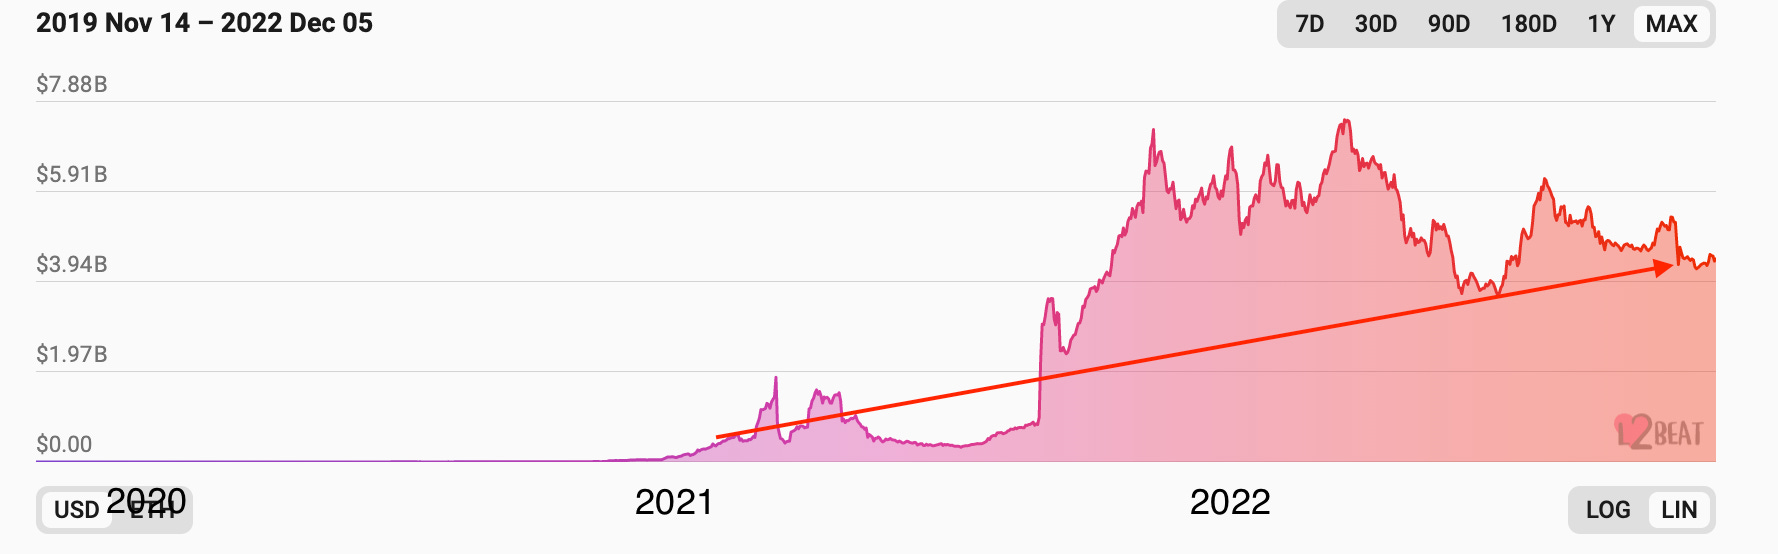
The first implication being that simple DAAs analysis can be misleading, requiring context for how these networks are being utilised. The second being ETH’s outperformance vs. BTC still looks reasonable over the coming years even if layer 2’s drive a large portion of economic value back to Ethereum during the next adoption cycle.
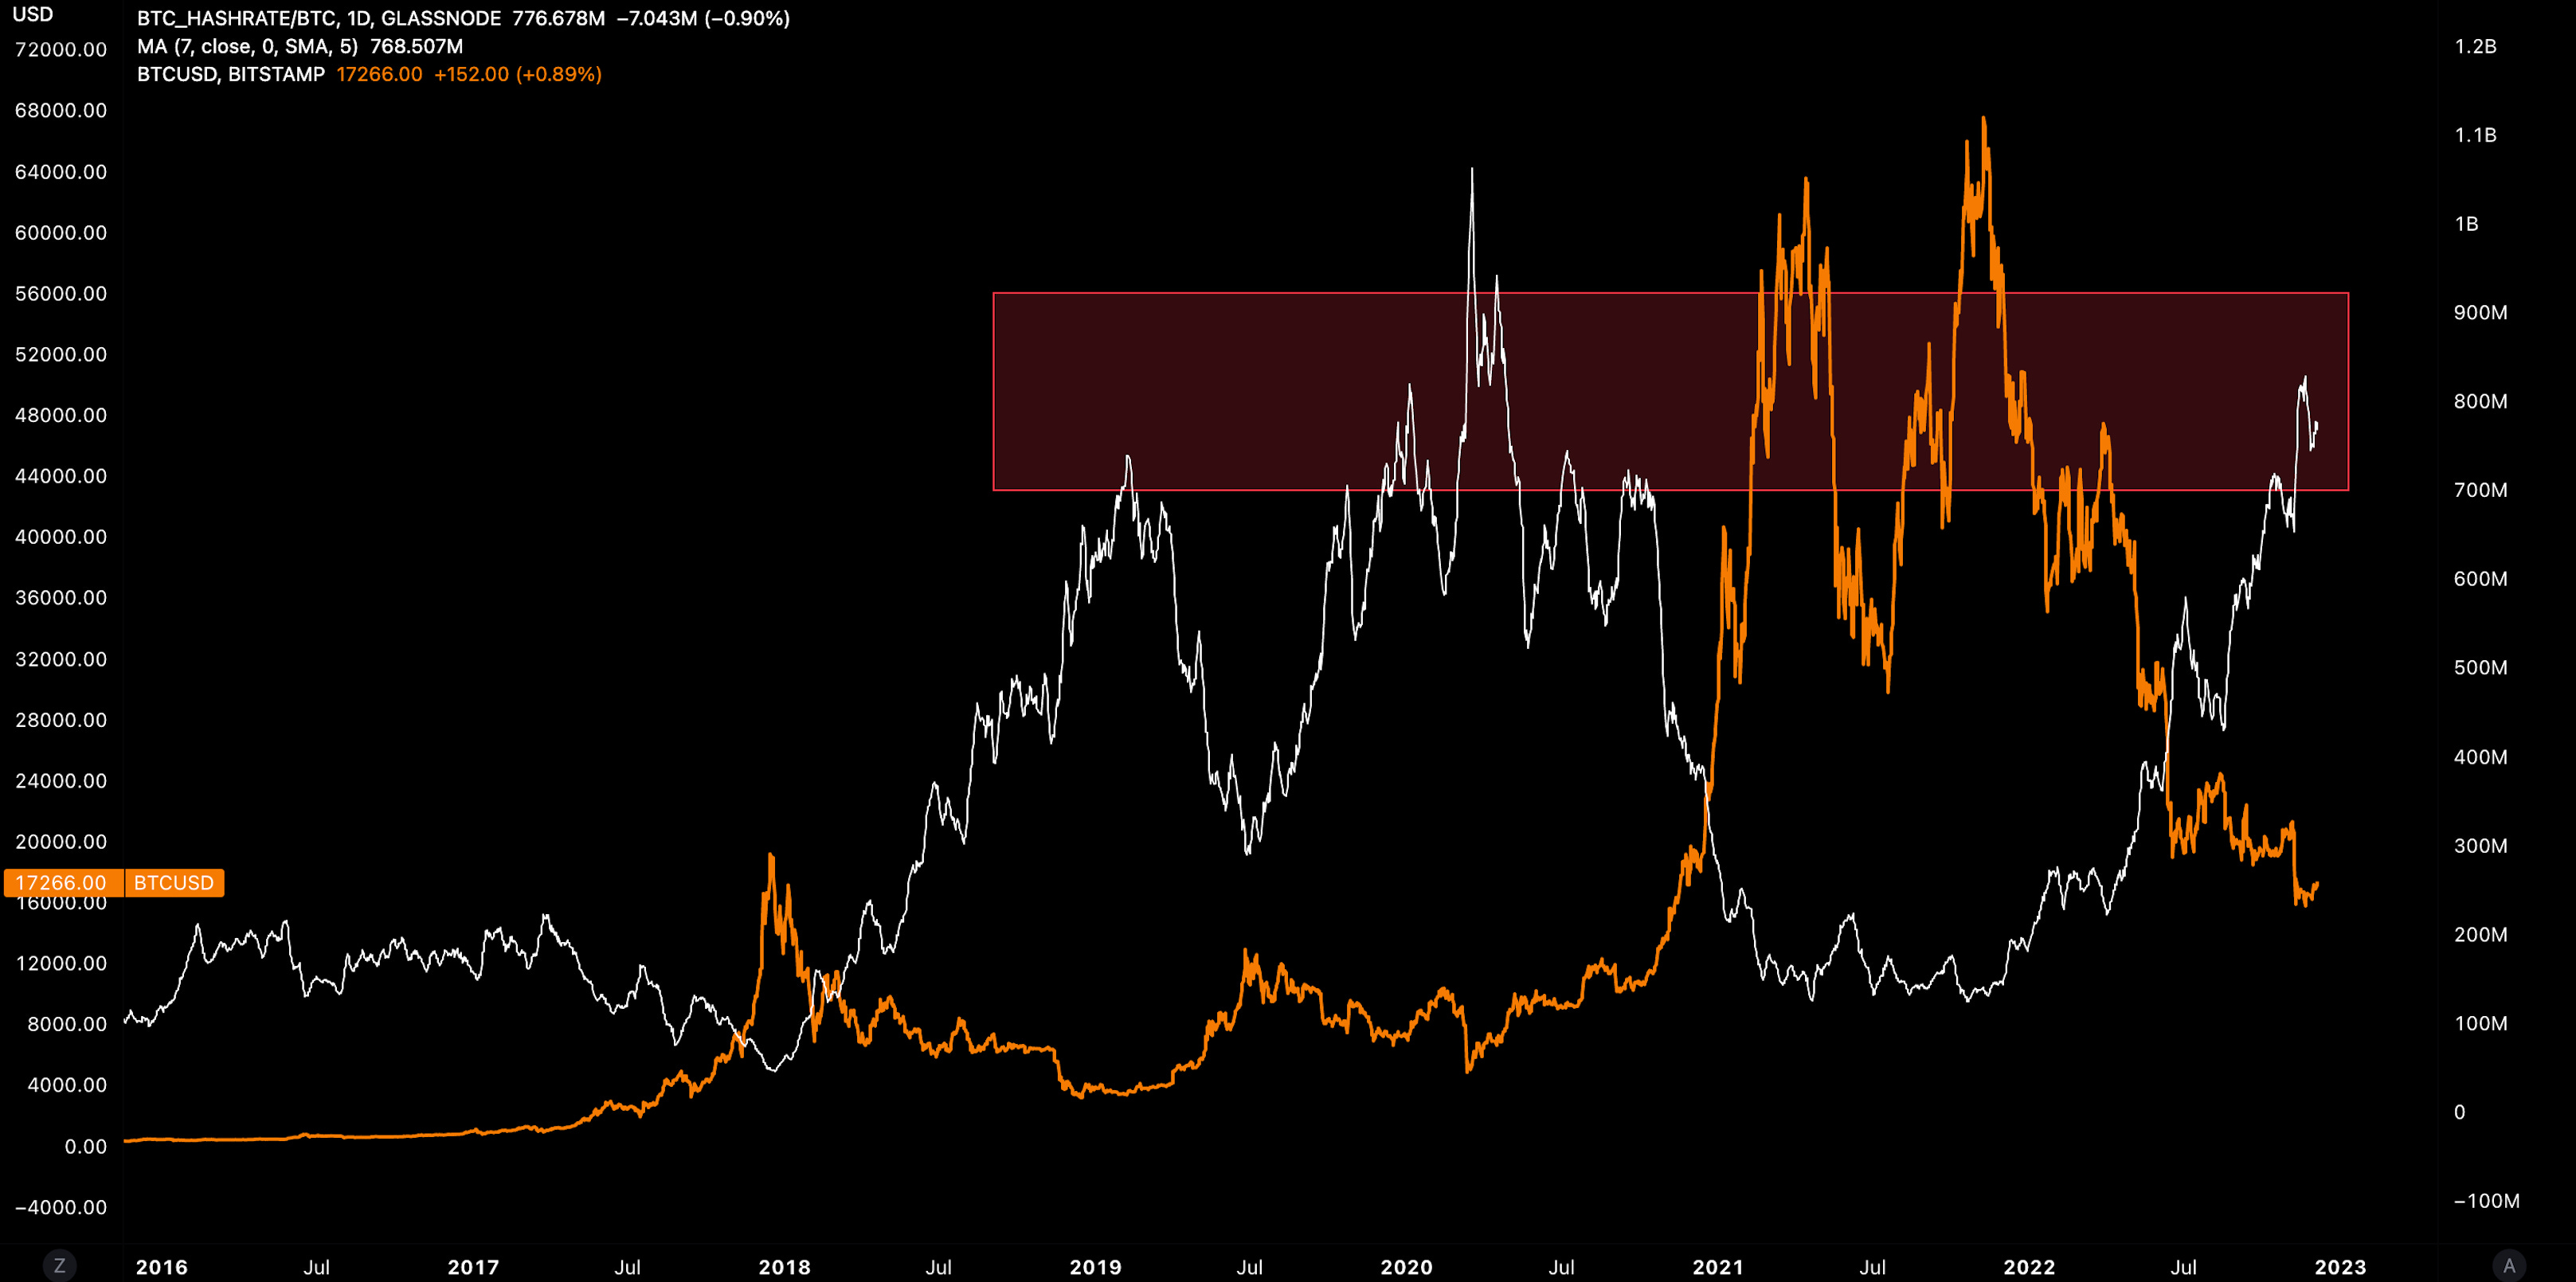
We need to talk about Bitcoin Mining
In March 2019, I remember Nic Carter presenting ‘10 years of Bitcoin Evaluating its performance as a Monetary System’.
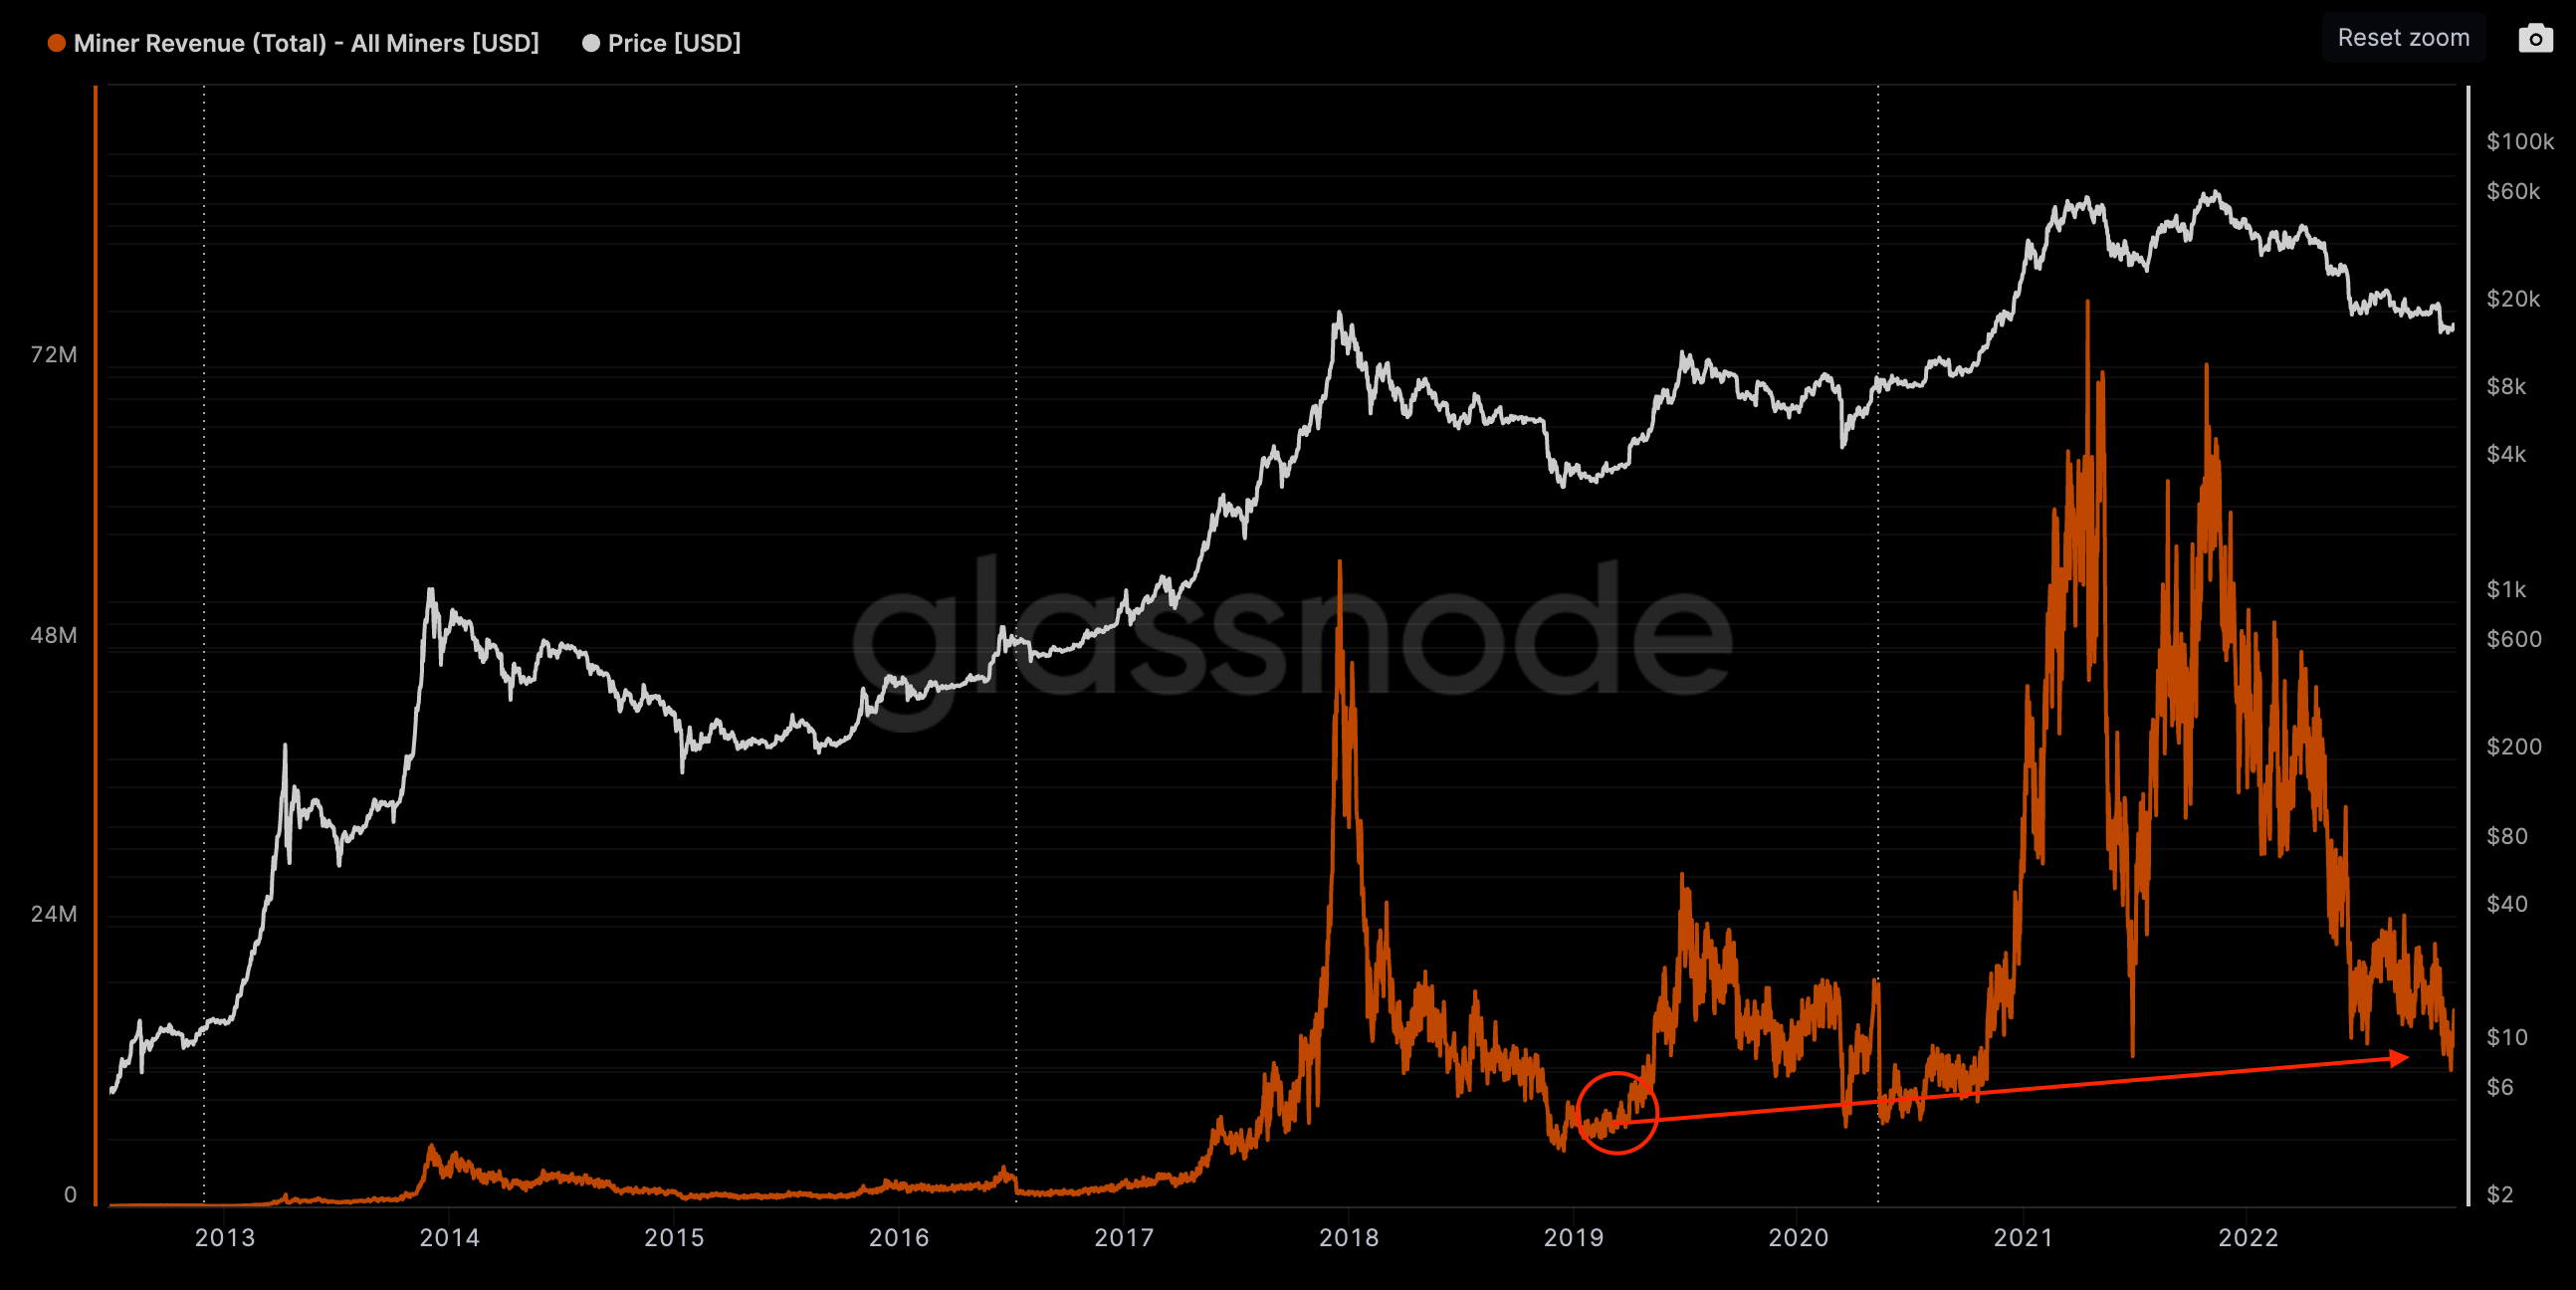
Nic’s concerns around Bitcoin’s long-term sustainable was simply. The network should look to increase its ‘economic density’ to offset declining block rewards for miners. In the following graphs, Nic’s presentation is indicated by the red circle.
It seems that these issues are only brought to light when market conditions are less favourable for the miners. Now long-term sustainability for Bitcoin is back on everyone’s radar.
Today, We see Bitcoin transaction volume falling substantially to ~$1B while Bitcoin hash rate signals a highly competitive mining landscape. In other words, since Nic presented the issues (and nearly 4 years later), we have not seen zero sustained growth in mining revenue derived from transaction fees.

Mining revenue from fees has only increased from 1.3% to 2.3% since 2019 too.

A counter point is to highlight the price growth since 2019 that is able to offset the decline in nominal block rewards + lower transaction fees accrued.
But that match up with the total mining revenue over the period which totalled $8.6m/day in 2019 to ~$15.5m today - just 2x from early 2019. Over the same period, BTC has increased in value by 5x presenting a clear divergence in total mining revenue growth vs. price.
Given Bitcoin’s transactions are priced in bytes and not by value exchanged, Bitcoin’s economic density (value transmitted per byte) is arguably a clear measure of its sustainability in light of falling mining rewards/highly competitive mining landscape.
The idea here being that network users can become more comfortable paying higher fees if higher value transactions take up more of each committed block.
The picture is bleak. Bitcoin’s dollar equivalent transacted per byte has fallen 80% since its 2021 highs or just 2x since Nic’s presentation.
This should illustrate that the Bitcoin network needs to be used more besides higher market value in order to find that path of sustainability.
The problem may only materialise in many years to come, but kicking the can down the road is not an option indefinitely.

Binance Dominance
We have seen Binance move from strength to strength over the past several months, aided by the collapse in trust with FTX and other market players.
Binance’s crypto-only exchange market share is reaching new ATHs of 87.7% in the month of December - a 30% gain in dominance YTD.

Binance’s stablecoin strategy is also working. In September 2022, Binance announced they would drop USDC trading pairs, auto-convert their stablecoins to BUSD, and make BUSD the primary stablecoin denominator on the exchange.
BUSD trading volume has grown from 7.6% to 26% over 2022 with dominance growing 10% in September 2022.

BNB has also been a good relative valuation trade throughout 2022 including with ETH (+64%) which has diverged completely from the broader market direction.
The BNB/ETH ratio has also gained 7% since FTX withdrawals were halted and continues to show resilience despite contagion fears across the market.
Decentral Park Market Pulse

Want real time updates and analysis on the digital asset market? Join Decentral Park’s Market Pulse group by clicking the link below:
Global Market Cap

$823B; Global market gained +3% over the past week (+$22B) and a further 1% on Monday. Total MCAP still trading at a discount to its 200d MA. Bullish divergence on daily/weekly RSI being realized.
DeFi MCAP

$36B; DeFi market cap still oscillating between the $34B-$38B range. Ceiling to break ~$45B for those seeking a higher conviction signal.
Bitcoin Dominance

40.4%; Little change in Bitcoin dominance over the past week but still positive growth as prices edge higher.
Trader Positioning
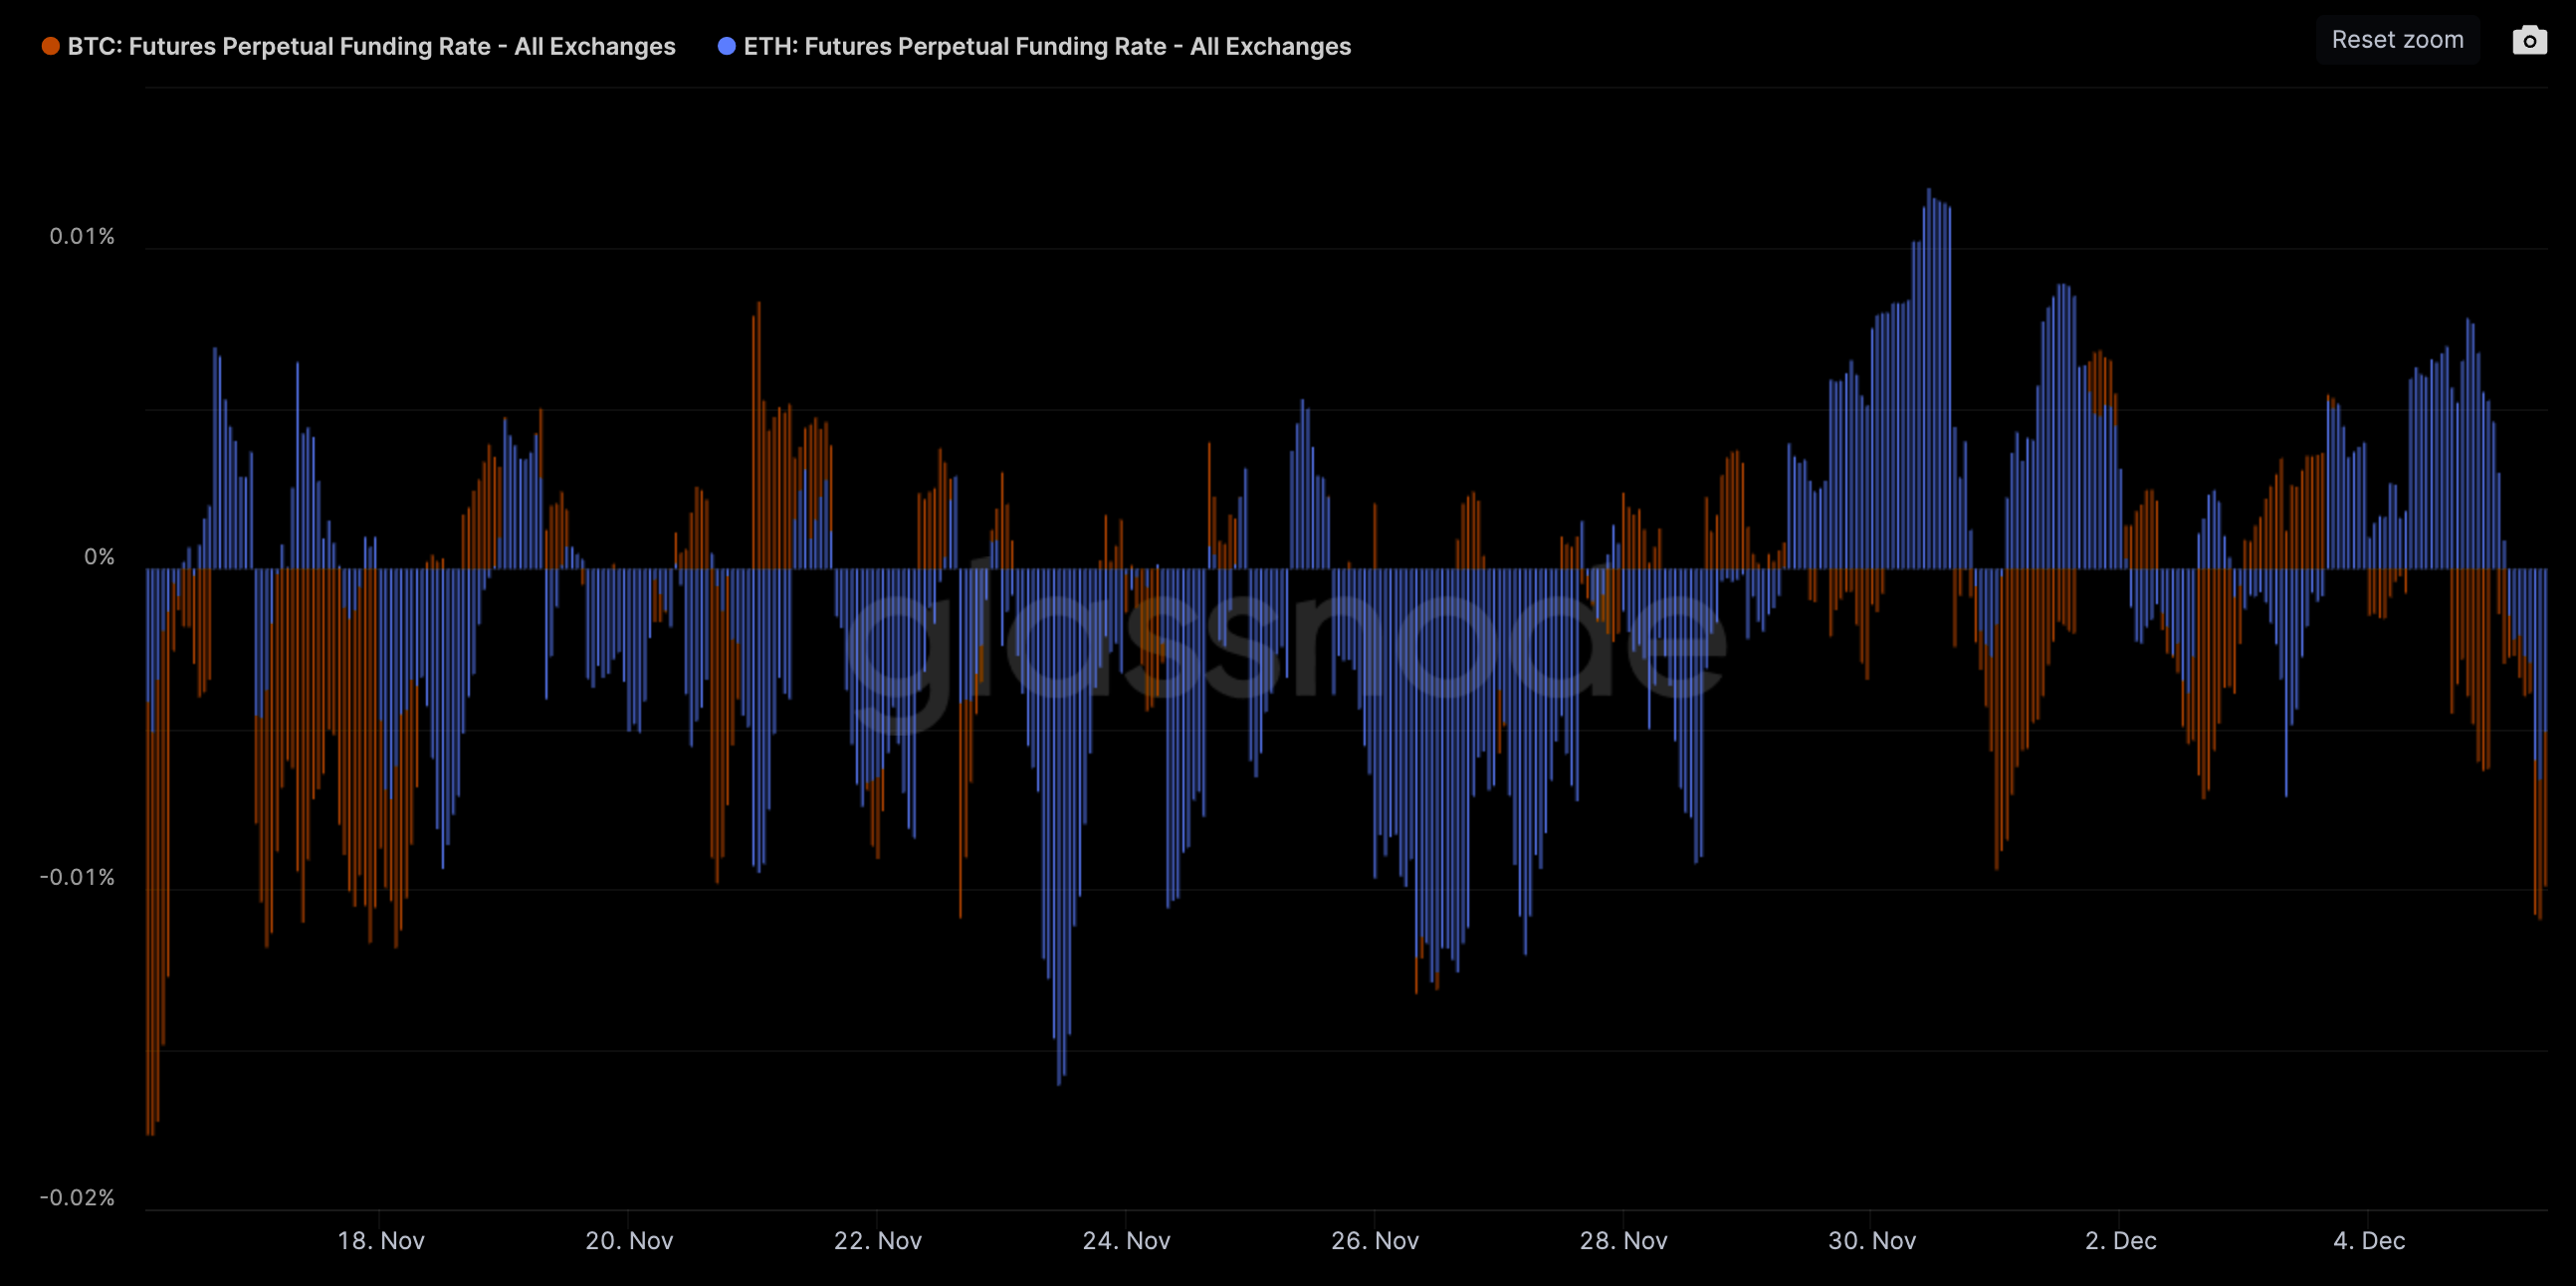
Aggregate funding rates for both BTC and ETH have flipped negative in recent hours indicating traders are taking a predominantly bearish stance.

No change in BTC and ETH futures OI over the past week which both stand at ~$5B.

30DEC options by strike (BTC): highest OI by strike (Deribit) is $30k for calls (7,800 BTC) and $15k for puts (6,400 BTC).

30 DEC options by strike (ETH): highest OI by strike (Deribit) is $3k for calls (280k ETH) and $1k for puts (47k ETH).
Grayscale GBTC

GBTC discount widening by ~2% over the past week as the market sees no clear resolution to the Genesis bankruptcy/DCG raise. Total loans by Genesis creditor groups has now totalled $1.8B+.
Unclear at this point if $600m-$800m of crypto collateral in the form of GBTC and ETH is held at DCG or Genesis. If the latter, GBTC and ETHE shares will likely be offloaded in the secondary market while the prospect of a spot ETF conversion looking less likely.
Grayscale ETHE

ETHE discount also widening by ~2% over the past week as the market sees no clear resolution to the Genesis bankruptcy/DCG raise.
ETHE’s discount has now reached the bottom end of the 2 year range. A break below this could indicate forced selling and/or market no longer buying/selling ETHE at technical levels.
Volumes

$14.3B; Daily exchange volumes are still down 82% from ATH levels printed in May 2021. Lower volume trend indicating a lower market interest aided by positions being washed out.
Aggregate Order Books
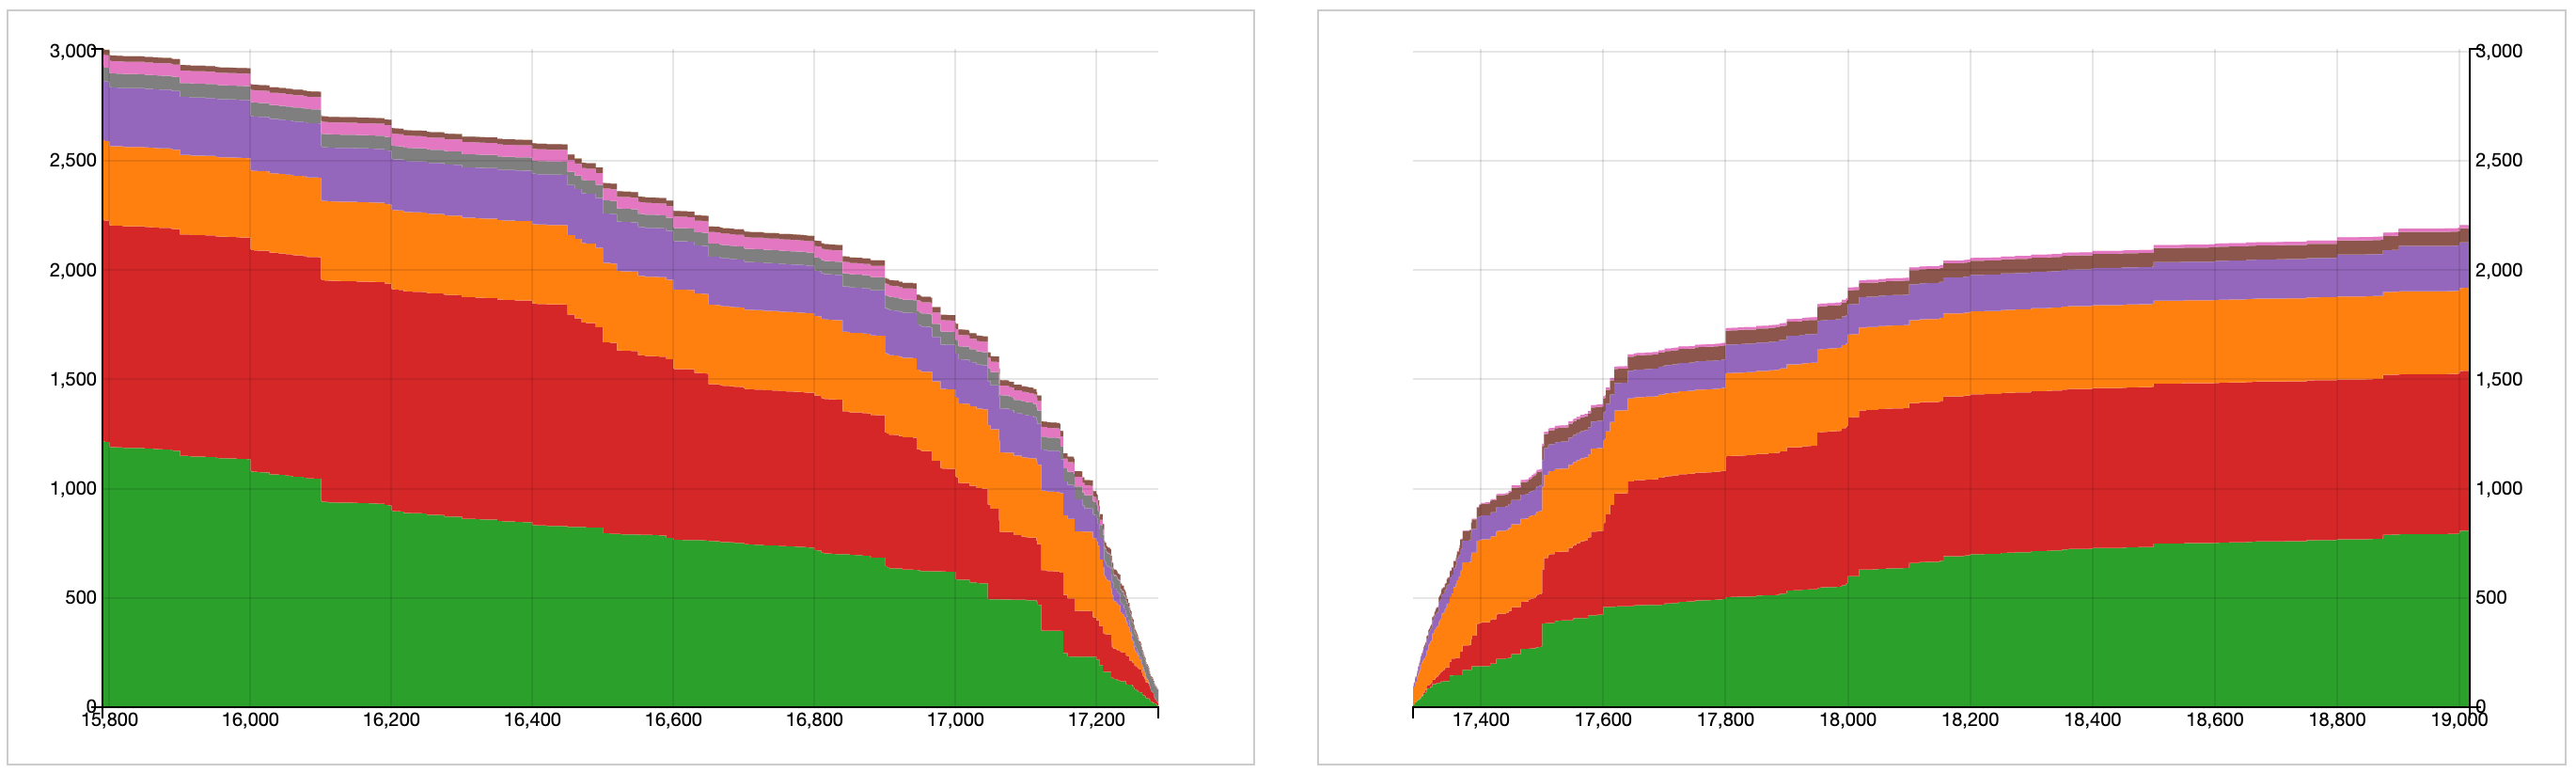
Order books look slightly heavier on the bid side. Heavier resistance up to $18k.
Miners
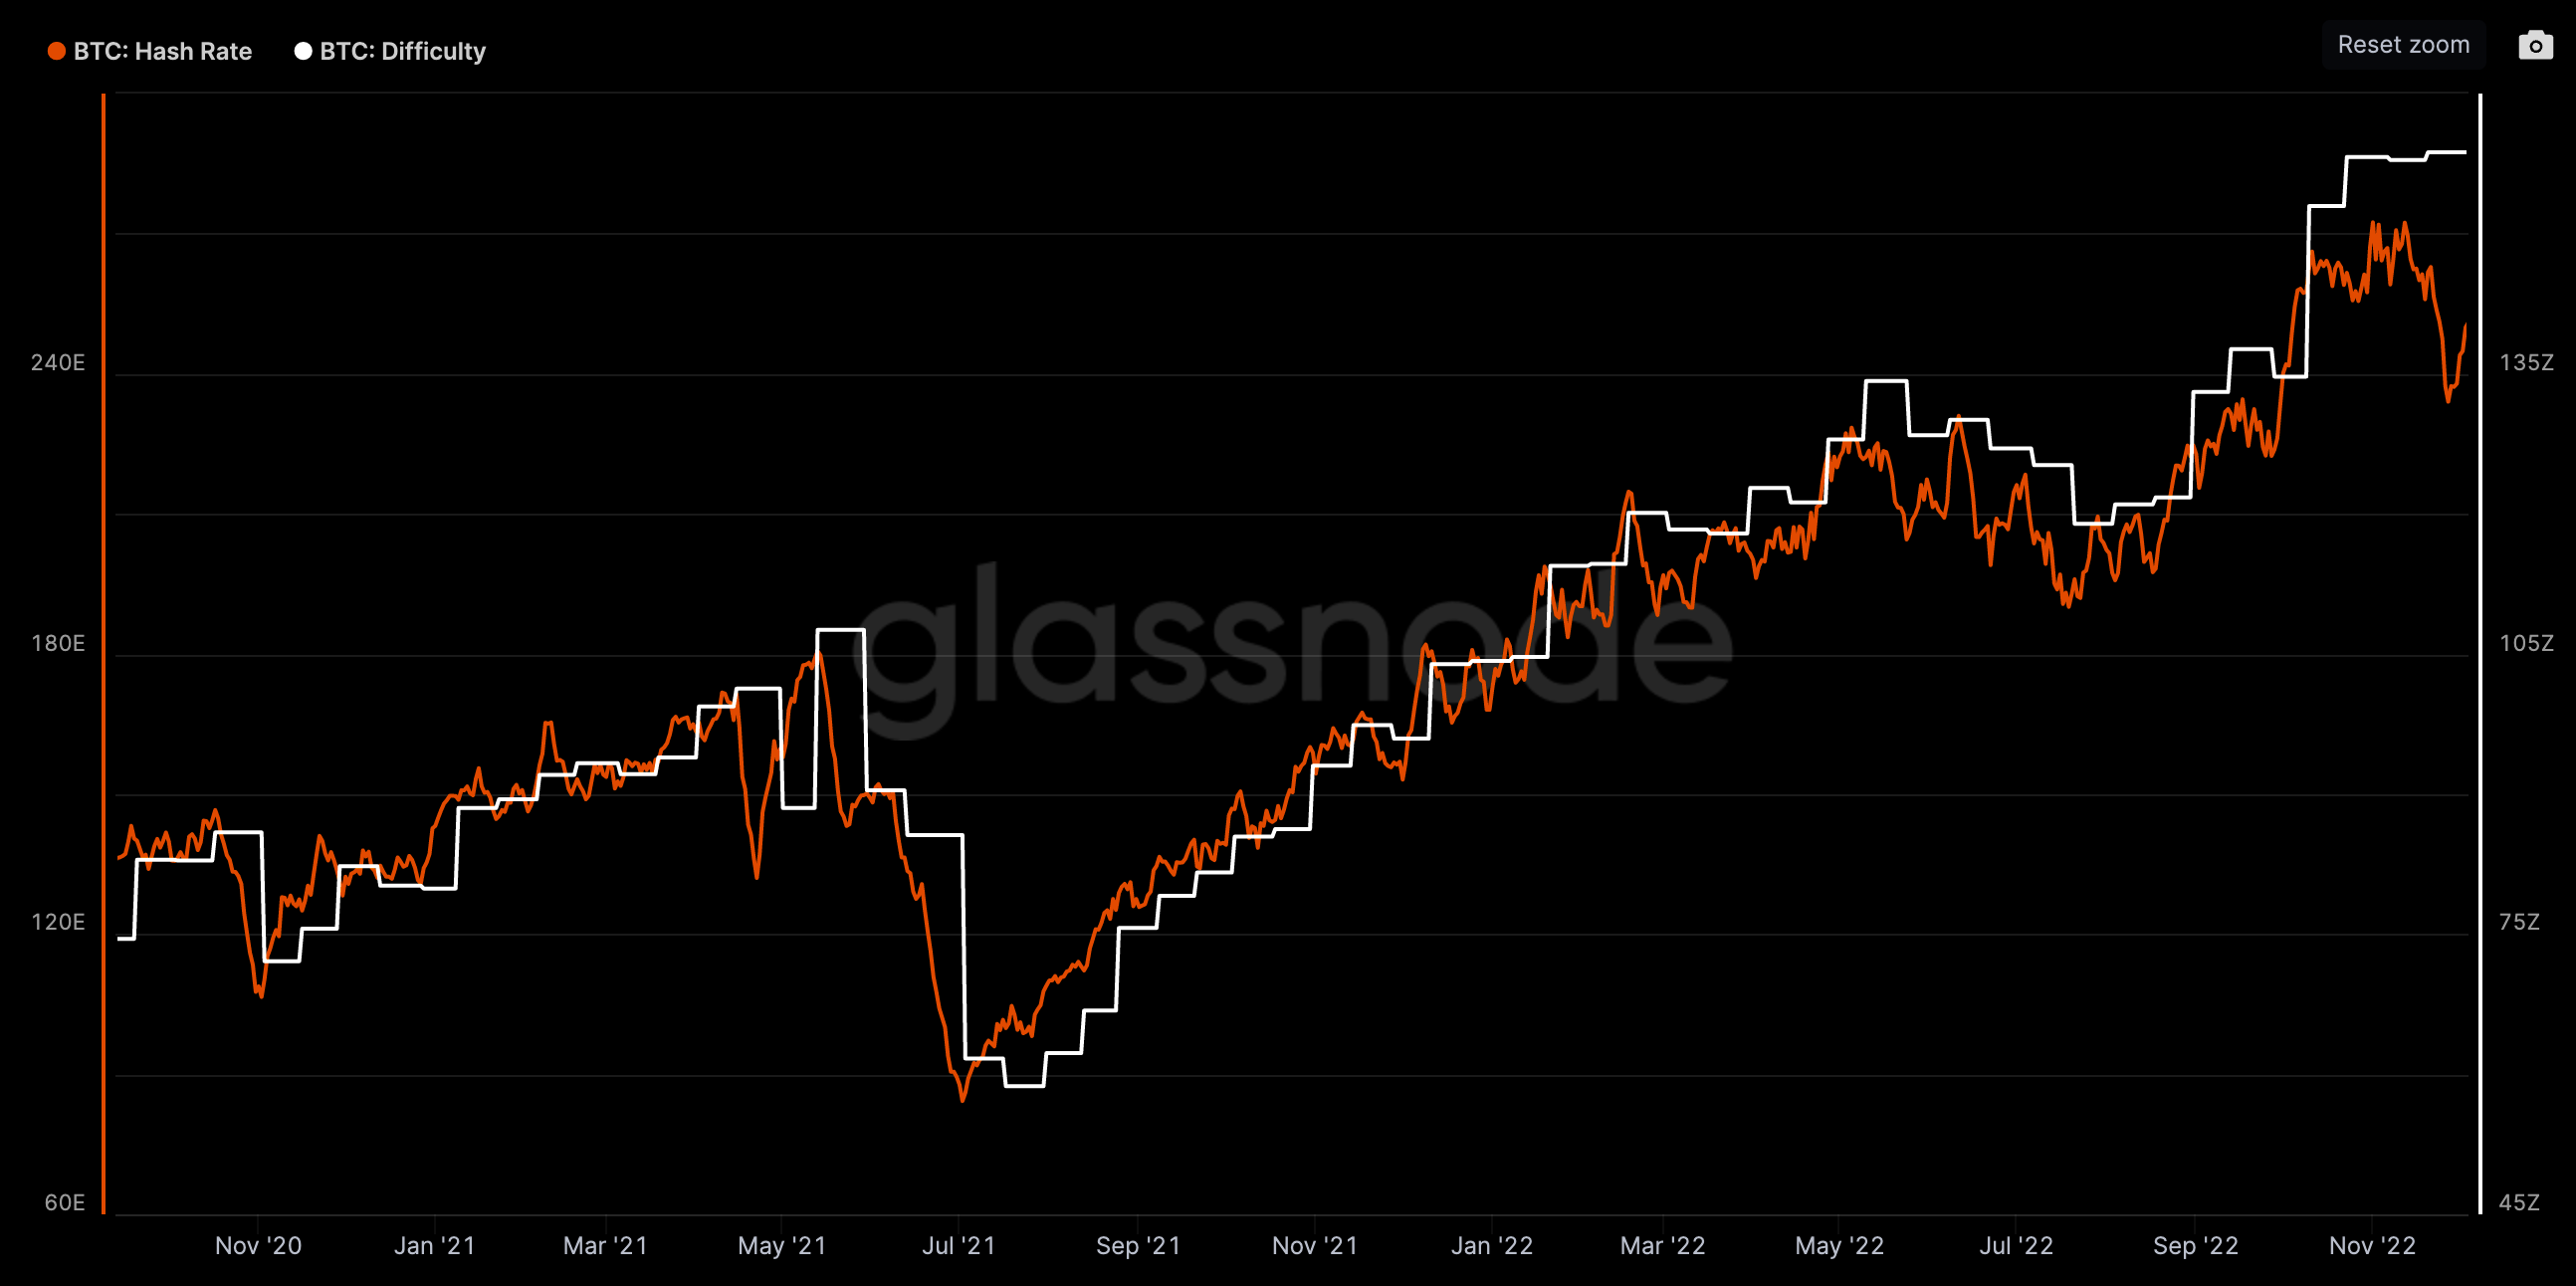
Bitcoin hash rate fell 12% from its ATHs before rebounding 5%. Miner commitment of resources to the network remains resilient as mining difficulty is at ATH levels.
Bitcoin hashprice climbing closer to near cycle highs as mining resource commitments is outstripping price growth. High hashprice has coincided with deep value territory for the orange coin in the past but the metric has equally been higher (March 2020).

No clear theme across top performing names. Fantom still receiving love after Andre Cronje analysed the protocol’s financials. Top performing DeFi names driven by mercenary capital positioning around headlines:
Top 100 (7d %):
Fantom (+35%)
GMX (+27%)
Axie Infinity (+22%)
Rocket Pool (+3%)
Trust Wallet (+21%)
DeFi Top 100 MCAPs (7d %):
DFI.money (+124%)
Dopex Rebate (+53%)
DeFi Kingdoms (+52%)
Wanchain (+35%)
GMX (+26%)
🎙️ Empire Roundup Dec 2nd [Empire]
🎙️ The Chopping Block #428 [Unchained]
🎙️ Decentralizing Block Building [On The Brink]
🎙️ A 2-hour Sit-Down With Sam Bankman-Fried on the FTX Scandal [The Scoop]
🎙️ The Regulatory Landscape post-FTX [UpOnly]
📚 On Crypto Fundraising [DefiIgnas]
📚 Breaking down FTX activity since 2021 [Ram Ahluwalia]
📚 Differences between stablecoins vs. CBDCs [Blockworks]
📚 Stablecoin PMFs [Will Clemente]
📚 'Twitter Coin' hints unveiled by tech sleuth [The Block]
The information above does not constitute an offer to sell digital assets or a solicitation of an offer to buy digital assets. None of the information here is a recommendation to invest in any securities.