


Join the 1000’s of founders, investors, crypto funds, brokerage firms, and developers in getting free cutting edge crypto research by subscribing below:
Why So Serious?
Global markets went into full tantrum mode after Jerome Powell succinctly stated the restraining inflation was a “statement of being resolute” at the Jackson Hole Symposium.
Former U.S. Treasury Secretary Lawrence Summers told Bloomberg that, while the speech was short, the Fed chairman did “what he needed to do”. The key implication of all of it was rates were to keep as high as necessary, even at the expense of a sharp economic contraction.
Initially, risk markets including crypto were choppy while the information was digested but the sentiment quickly turned sour.
We believe the initial reaction was a bluff test to Jerome Powell: “show me the rate hikes when we have a sharp economic slowdown and I will show you the sell pressure”. Markets held up as a consequence with BTC keeping above $21k.
Just one hour later, things turned sour as there was soon a realization that these hollow markets were fighting a determined Fed.

The NASDAQ tumbled 4.3% from its intraday peak until close while crypto plummeted through the $1T MCAP mark. Meanwhile bonds slumped with the US2Y reaching its highest level since 2007.
Markets were so hooked on the QE pills, optimism was their only remedy when the hangover took hold.
There was never a realistic Fed pivot on the cards this year. No paths for rate cuts short-term. One data point is not a trend and fundamental macro headwinds remain.
It’s not just the US that will feel the pressure of high rates. Asian stocks have tumbled as Powell spurs a wider risk-off mood globally. The MSCI Asian Pacific Index has slumped 2.3% - the worst since June 13th 2022.
Last week, a measure of US profit profit margins reached its widest since 1950 - prices faced by consumer are outpacing the increased costs for production and labor.
Why does this matter? Companies are able to comfortably offload costs to the consumer and has fuelled healthy equity valuations over summer.
However, with demand destruction being the Fed’s necessary antidote, these profit margins will begin to break.
At risk of sounding like a broken record: The H1 ‘22 re-rate in equities was very likely an adjustment to tighter monetary policy. A second re-rate (if it were to happen) was a corporate profit adjustment and worsening economic outlook (higher rates starting to slowdown the economy).

In our Price vs. Growth edition of the Weekly earlier this year, we noted the imminent battle between the price and growth camps. The Fed (+ bond markets) took on the former and the equity markets took the other.
One camp was to blink first. Turns out it was the growth camp who buckled under the pressure.
Don’t fight the Fed. All you can do is just keep on smiling.

Concerns Remain
Global crypto MCAP is now 68% from its all-time-highs and just 18.5% away from its 2022 low.
Comparing to previous cycles, the cryptoasset market has a significant amount of room (-59%) to fall in order to reach the typical 80-88% historical cycle drawdown range. Of course, whether history repeats is another question altogether.
Regardless, one can help but see a similar playbook start to form:
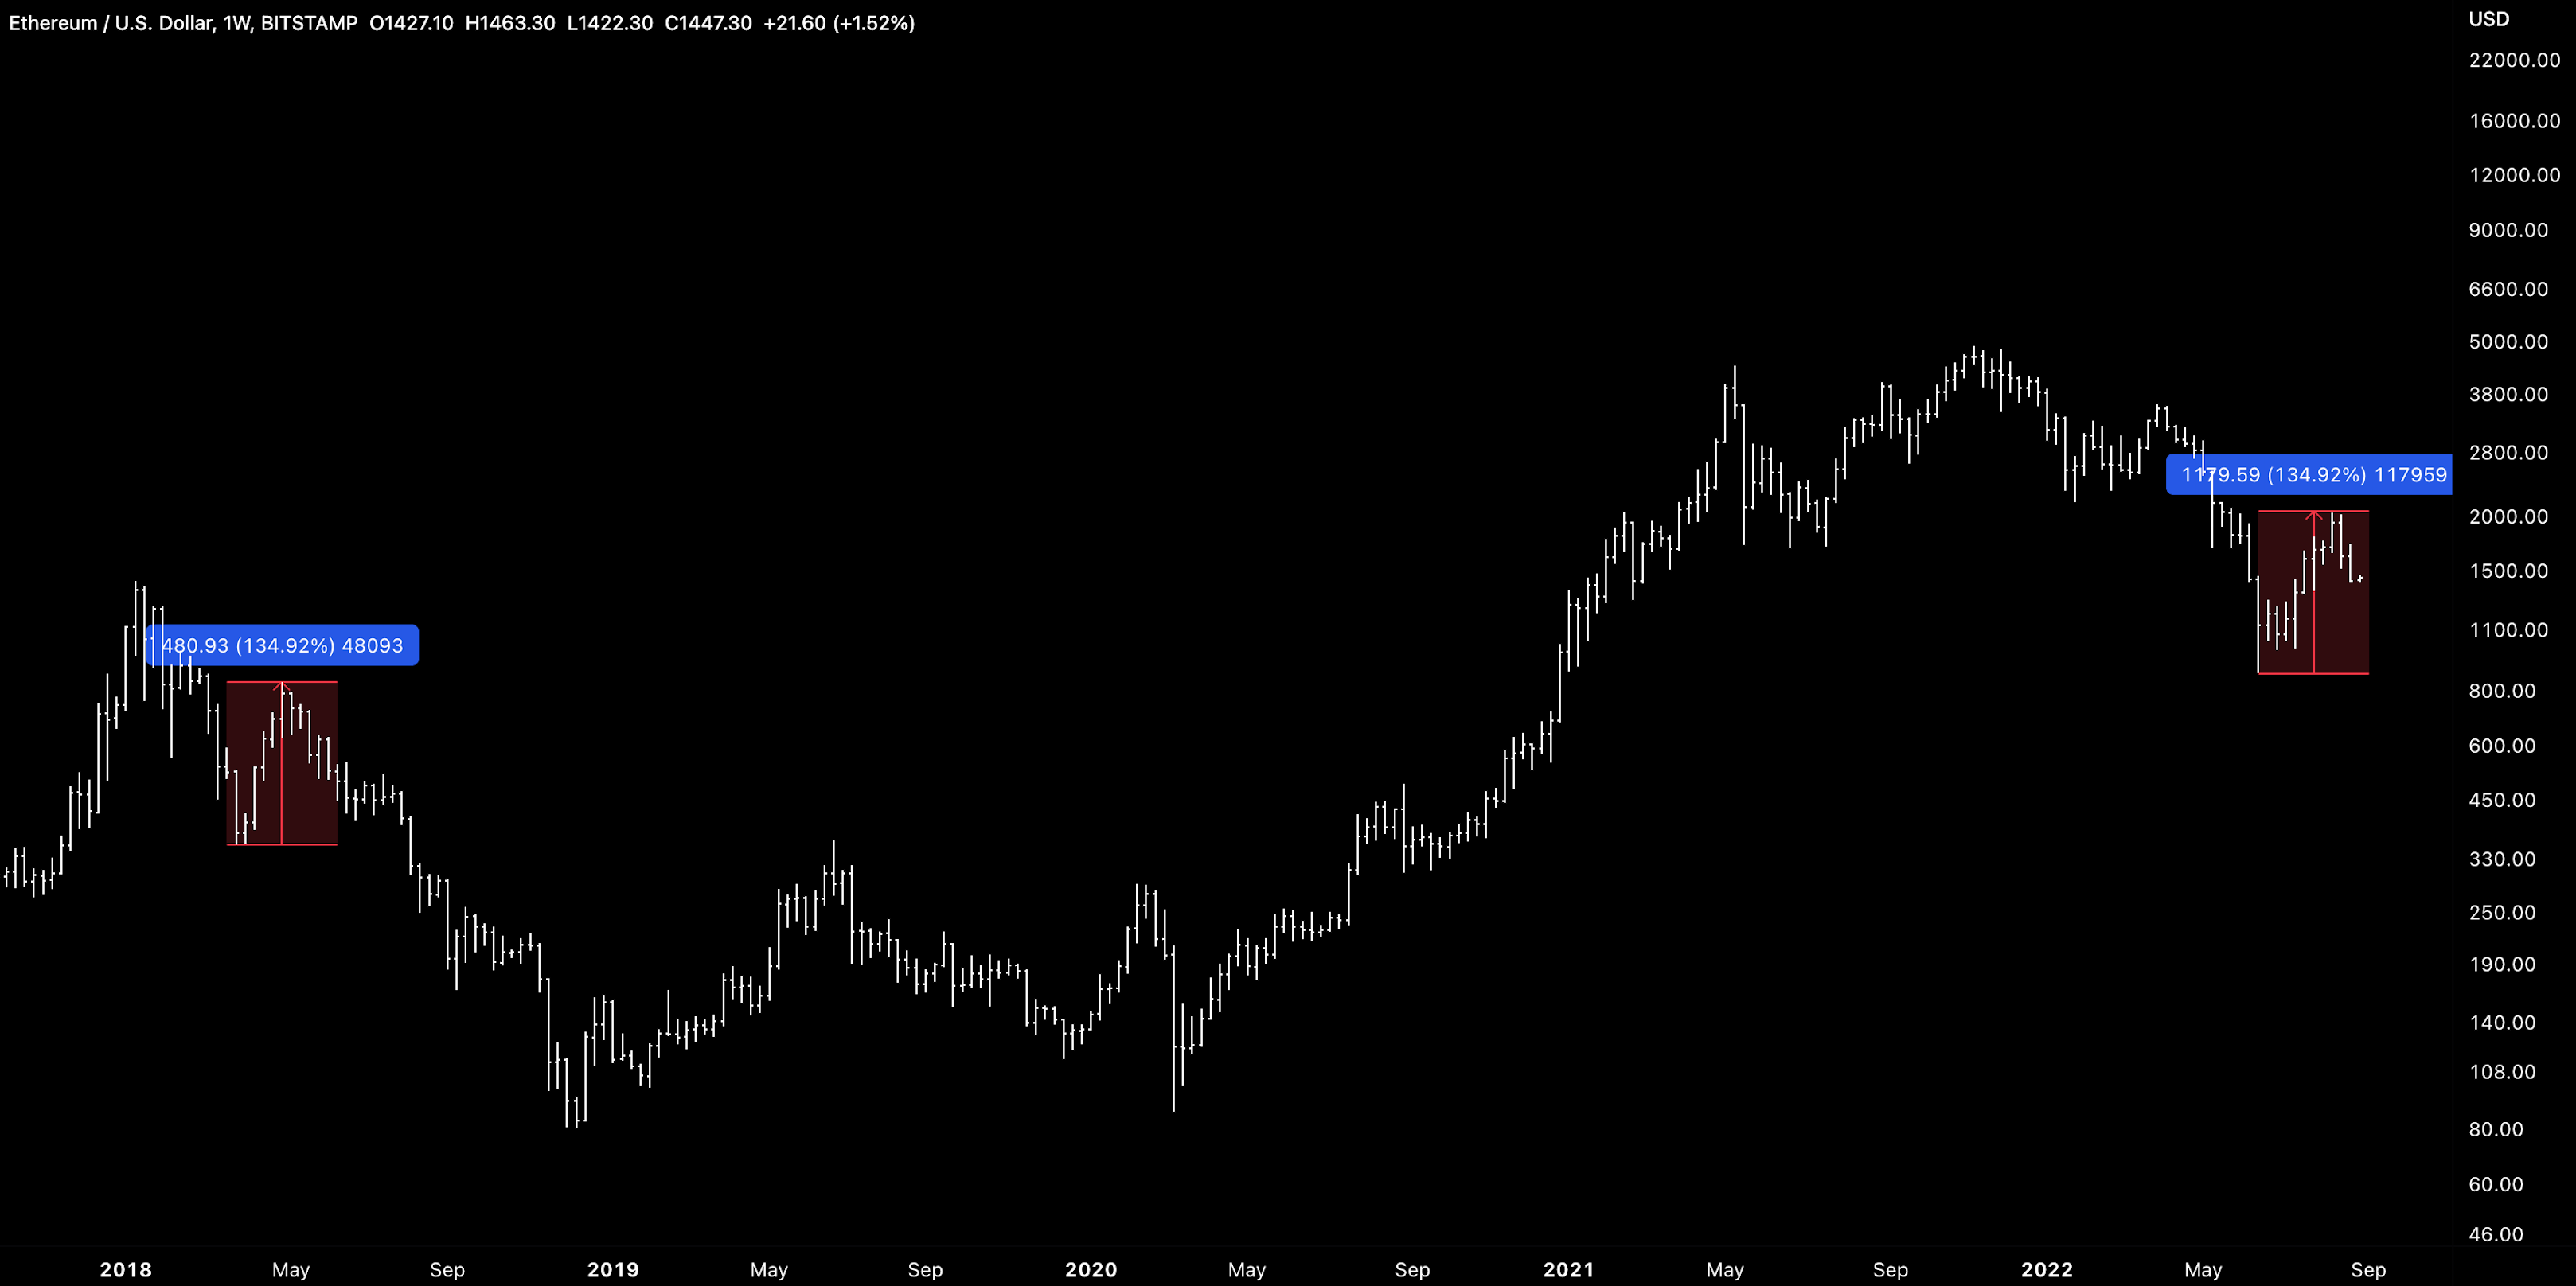
The bear market rally of 2018 lasted 5 weeks
The bear market rally of 2022 lasted 5 weeks
ETHUSD bear market rally of 2018 +135%
ETHUSD bear market rally of 2022 +135%
The bear market post initial rally of 2018 lasted 7 months
The bear market post initial rally of 2022 lasted ...
As investors have learned this year, optimism and realism can be two very different constructs and it pays to learn about the drivers of different outcomes down the road.
Further declines in risk assets will likely be fuelled by elevated (if not rising inflation).
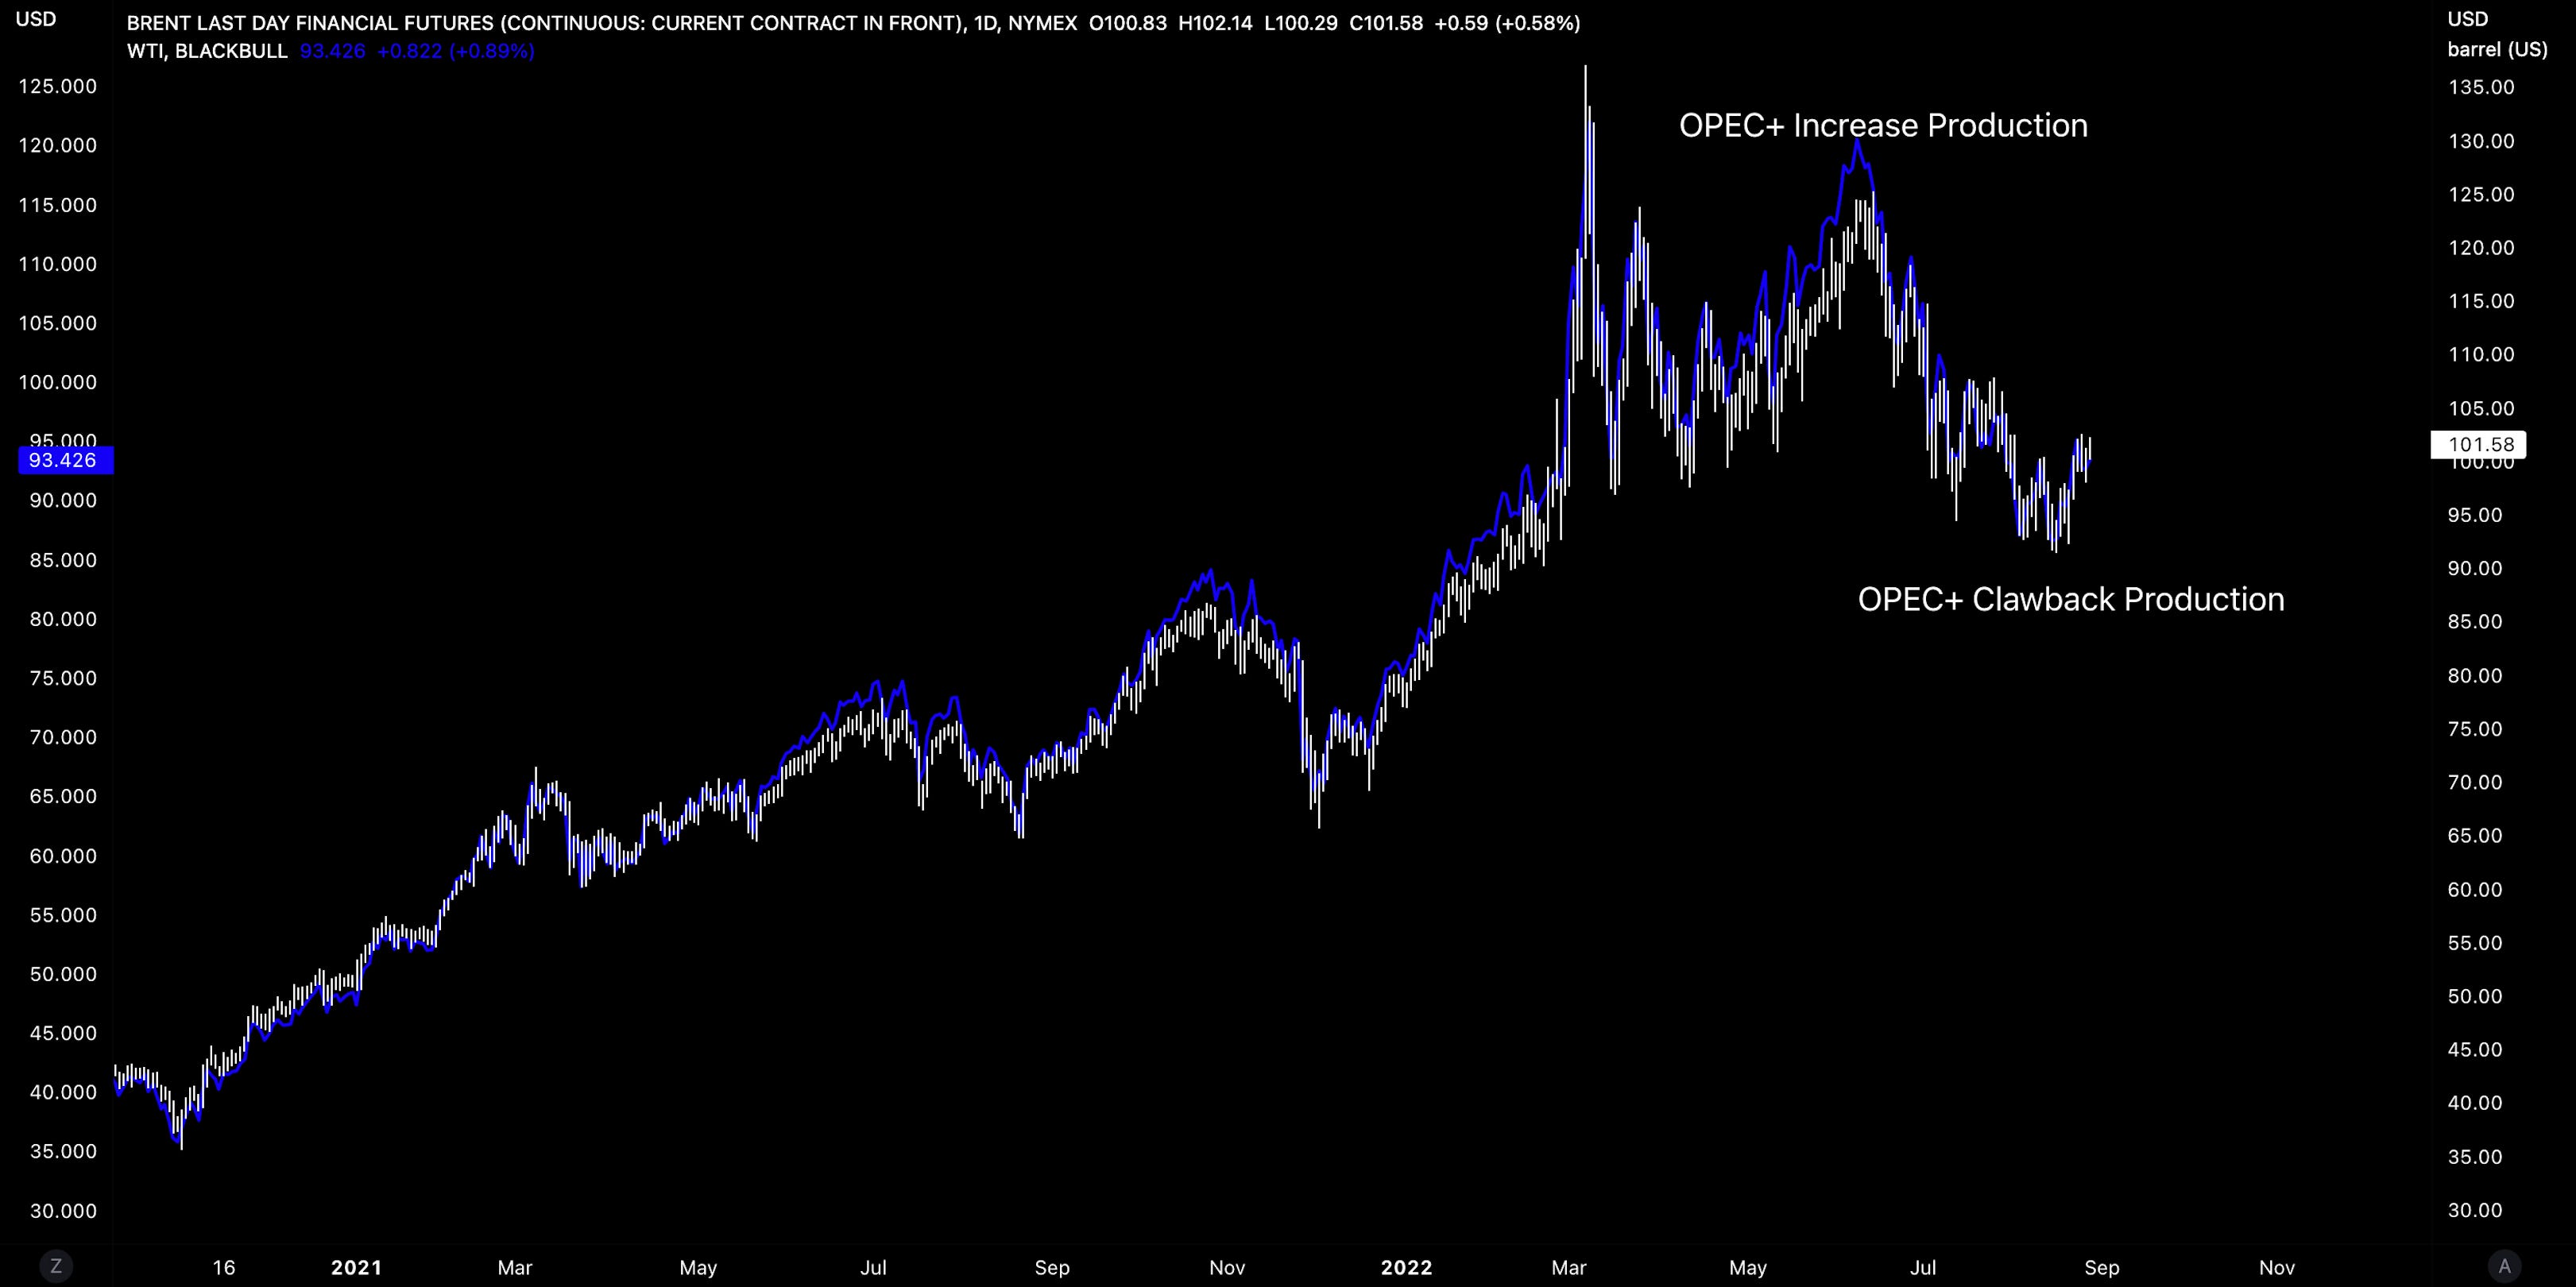
One concern besides corporate profits adjustments are rallying oil prices which are now +11.17% from their 2022 lows. We see several drivers of potential higher prices:
OPEC+ reducing production as they are interesting more supply but at higher prices (demand will always be there). UAE and Oman back possible output cut
Libya conflict impacting crude supply
Missed production targets
Europe countries switching from gas to oil for power generation as benchmark power price break new record highs
Colder winter months ahead in the northern hemisphere (cooling to heating)
Russia politicising gas supply to Europe
Note, a quick WTI 0.00%↑ chart shows that the problem of elevated oil prices behind inflation is not just simply a European problem.
Put simply, the inflation rate will accelerate if energy prices continue to rise.
Another concern is tighter liquidity heading into an accelerated period of QT by the Fed where $90B in assets will be allowed to run of the balance sheet. The correlation between liquidity conditions and cryptoassets remains high and the failure of QT in recent months can help explain the buoyed prices.

There are open questions of the effectiveness of QT vs. proposed targets by central banks. For example, in 2017 the Fed took a slow approach to QT but overnight market rated jumped late 2019 as reserved began to become too scarce. The history books tell us that this ultimately drove the Fed to increase liquidity once again.
At least for now, we see the current QT proposal as a headwind for risk assets even if the runway of QT are short lived. We see risk assets needing a more complete re-rate if we are to see prices normalize against the fed balance sheet once again (mean revert).

Tighter monetary and liquidity is also squeezing the dollar higher. DXY has broken new highs 109.2 and limited resistance until ~120.
This does create headwinds for oil prices but also for risk markets more broadly. The dollar milkshake theory may now start taking an increasing toll on risk markets this week.
The savour in markets will likely be weaker economic data with US consumer confidence, China PMI, Euro-area CPI, and US nonfarm payrolls all released throughout the week.
We do believe that some material dislocation in the markets (e.g. credit) may provide the respite investors are looking for although the road to this type of outcome is still largely unknown.

However, the signals of direction nearer term are there. SPX and NASDAQ futures are down 1% and 1.27%, respectively - the latter moving even further away from its 100d SMA.
So given the exogenous pressures on cryptoassets, we would need to see a ‘good level’ of market interest being used as support. We don’t have to look beyond core metrics to be concerned.
Spot volumes have yet to be convincing with average volumes being materially higher than current levels. This is despite recent uptick in volumes which were likely driven by a surge in liquidations.

We’ve also seen idiosyncratic selling for assets like AVAX which has dropped 22% since Friday after a self-proclaimed whistleblower published a report claiming litigation weaponized by Ava Labs.

One takeaway here is that negative headlines may be more impactful to asset performance in a more skittish and increasingly concerned market than earlier this year. Long investors, beware.
On-Chain Indicators
‘Forward looking’ on-chain indicators such as hash ribbons have provided some hope for investors given they were used as rare, high conviction signals. Recent ‘buy’ prints that indicate the end of a long miner capitulation have so far just been met with dampened prices.
Their validity has yet to be proven in the current (and different) macro set up. BTC hashrate has climbed to 221m TH/s - +17% from annual lows. Note, hashrate could already be peaking before resuming its 2022 downward trend.
However, depressed spot prices and stains on the power grid against this growing hash commitment will likely create a tighter mining market once again and put pressure on miners to sell inventory.
These models don’t factor in the macro at all so we use these models with extreme caution.

Metcalfe’s-style models equally paint a bleak picture for cryptoassets valuations. Active addresses for major like BTC and ETH have kept range bound within a descending channel since last year.
Price and underlying usage of networks do appear to be interlinked (high correlation) and would imply that collapsing network adoption would be met with collapsing prices.
Note, the derivative market can muddy the waters here (as we’ve seen with ETH merge traders impacting the markets).
Equally, a sustained break outside of this channel may prove meaningful as it marks a new period of network adoption growth.
Finally, declining economic activity also dilutes economically bullish arguments for networks like Ethereum where the amount of ETH burned via EIP-1559 will be measured by the transaction value occurring on the network which is also in decline.

Decentral Park Market Pulse

Want real time updates and analysis on the digital asset market? Join Decentral Park’s Market Pulse group by clicking the link below:

No clear trend in top performers over the past week with catalyst/headlines appearing to impact price.
Top 100 (7d %):
eCash (+26.3%)
Evmos (+19.7%)
Huobi (+15.1%)
BitDAO (+13.6%)
Chiliz (+10.5%)
DeFi Top 100 MCAPs (7d %):
Stargate (+25.9%)
Tribe (+17.3%)
GMX (+10.4%)
Maple (+8.2%)
Alpaca Finance (+6.7%)
Synthetix launched incentive program on Optimism with 10k OP rewards for Curve sUSD/3CRV pool (7% APR) and 10k OP for sETH/ETH pool (11% APR)
Perpetual started Pool Party rewards program, 27K OP & PERP per week are allocated to ETH market.
Euler Finance, a lending platform on Ethereum, launched a proposal to promote stETH to collateral tier. Currently users can supply stETH for 1.5% and borrow it for 4%.
Beefy boosted wstKSM - xcKSM with LDO tokens, current APR is 40% APY.
Global Market Cap

$1.05T; Global market cap fell 18% last week. MCAP has opened steady (+0.92%).
DeFi MCAP
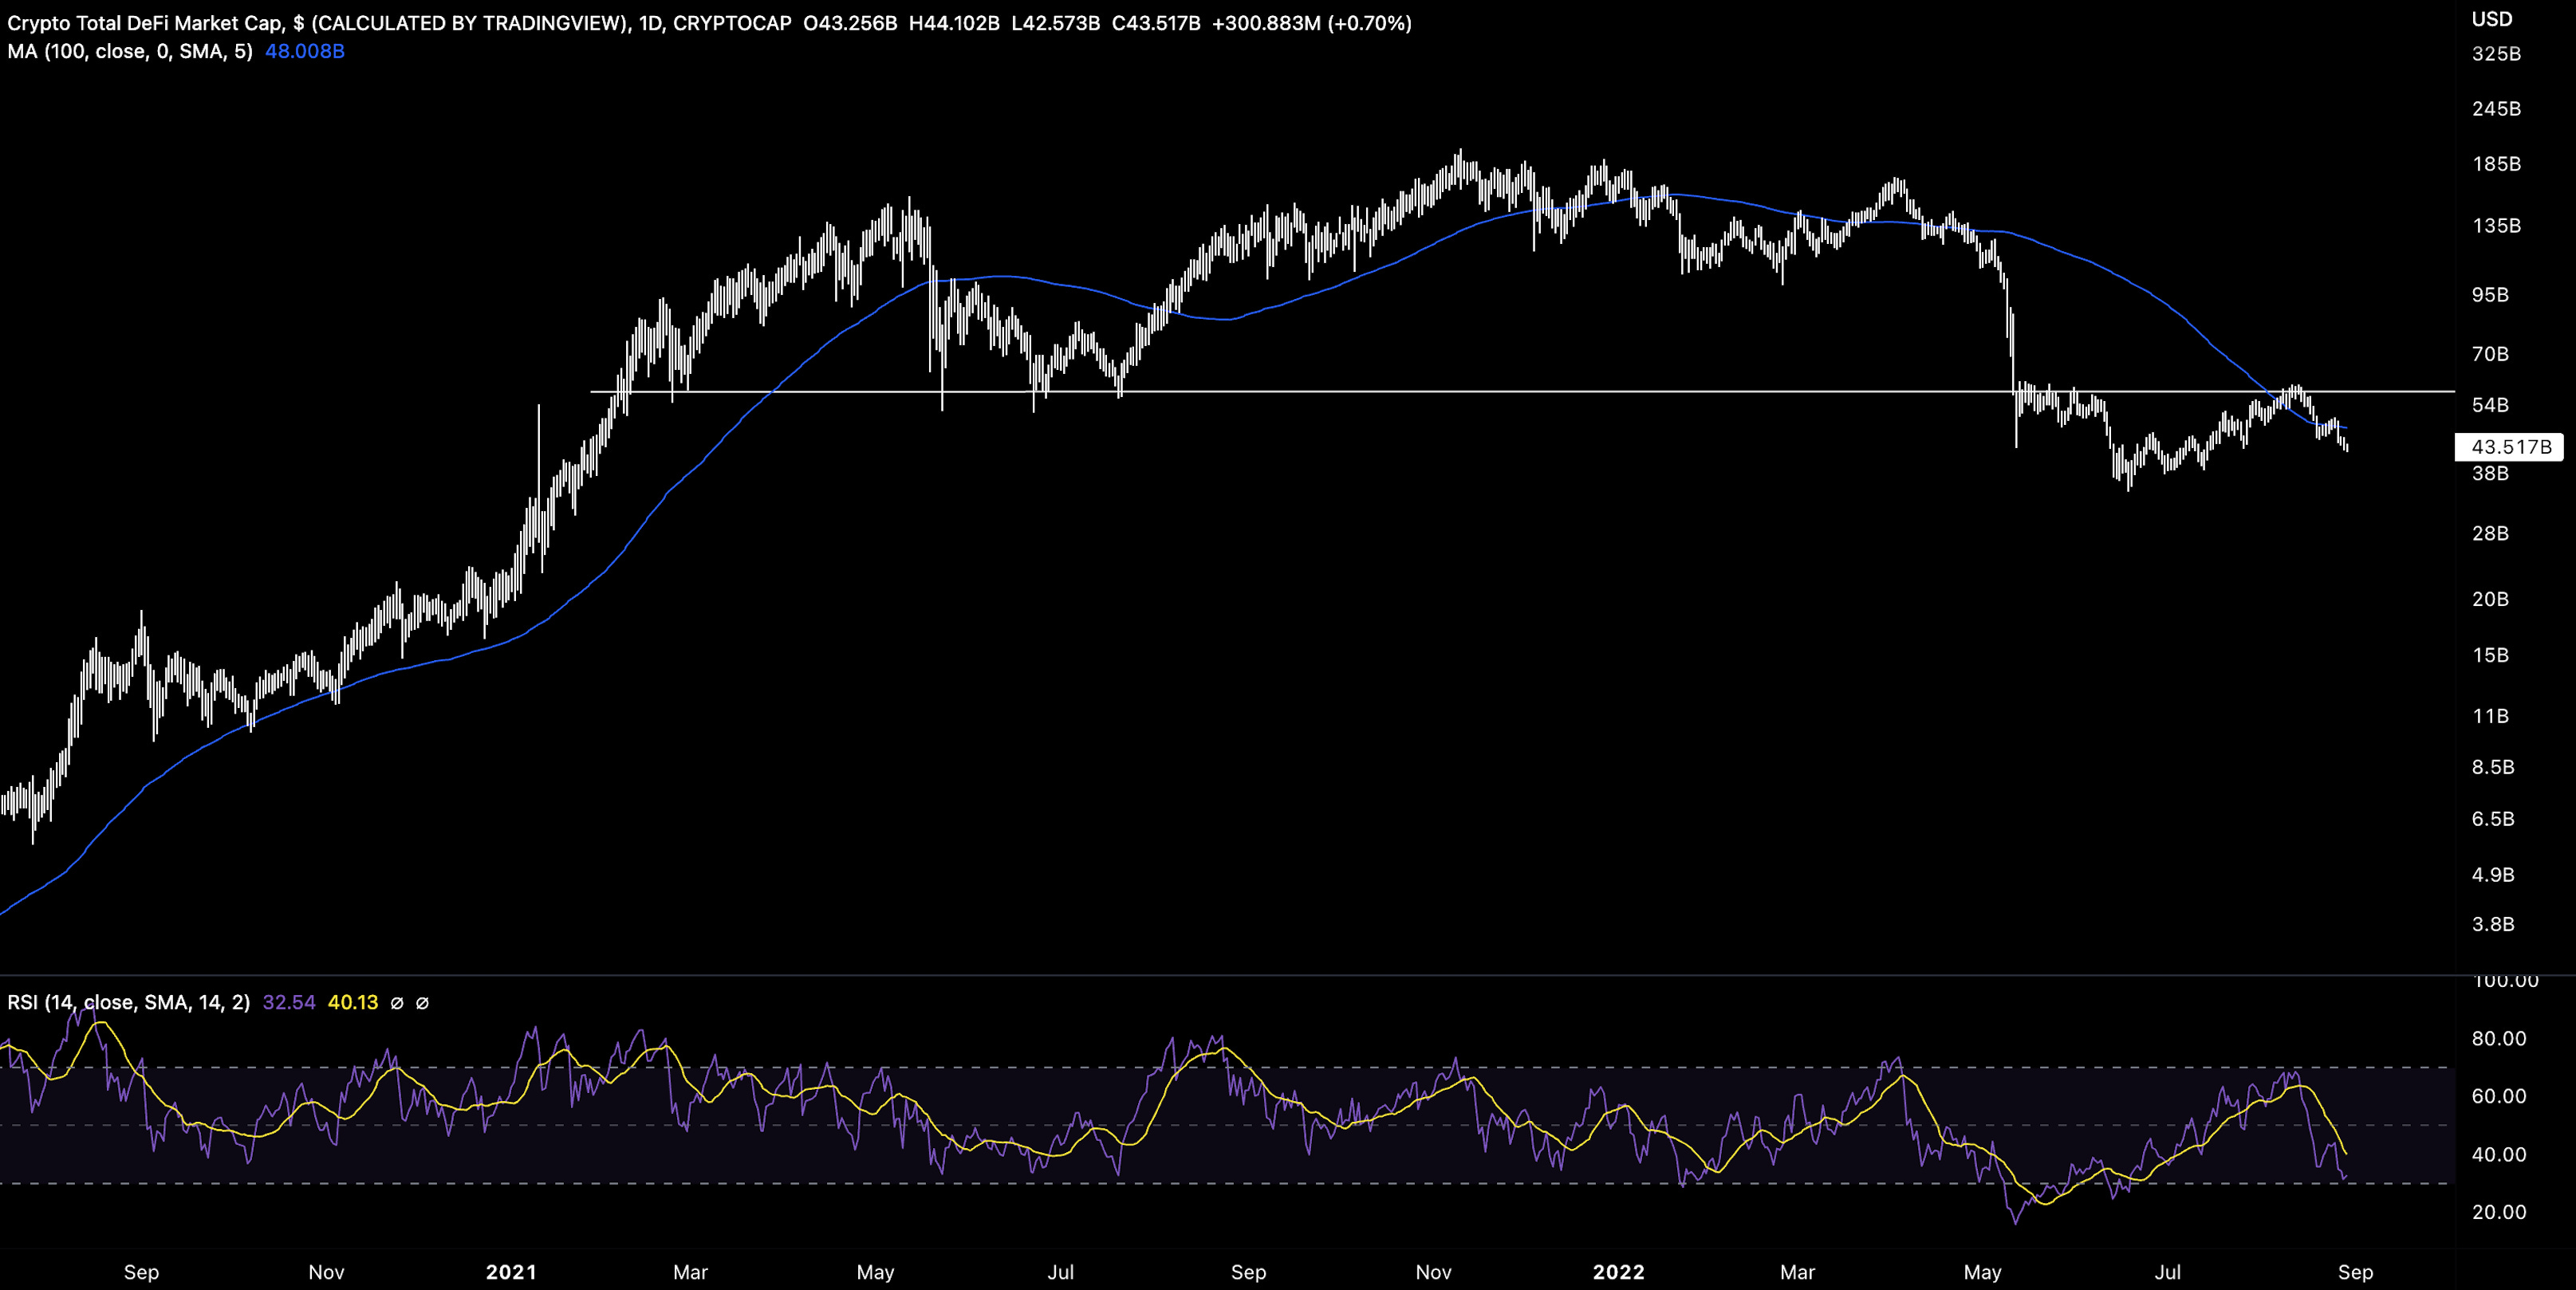
$43B; DeFi market cap fell 9.38% last week. The index has ~20% until it reaches its annual low of $34.2B.
DeFi Dominance

4.68%; DeFi dominance is now -41.5% from ATHs in March 2022. DeFi dominance will move in tandem with DeFi MCAP and the broader market (positive relationship/reflexive).
Bitcoin Dominance

40.7%; Bitcoin dominance has been in the decline since July as stablecoin dominance picks up and investors look to de-risk over the period.
Volatility

BTC; Seeing a drop in short-dated IMs perhaps indicating consolidation for the near future.
Trader Positioning

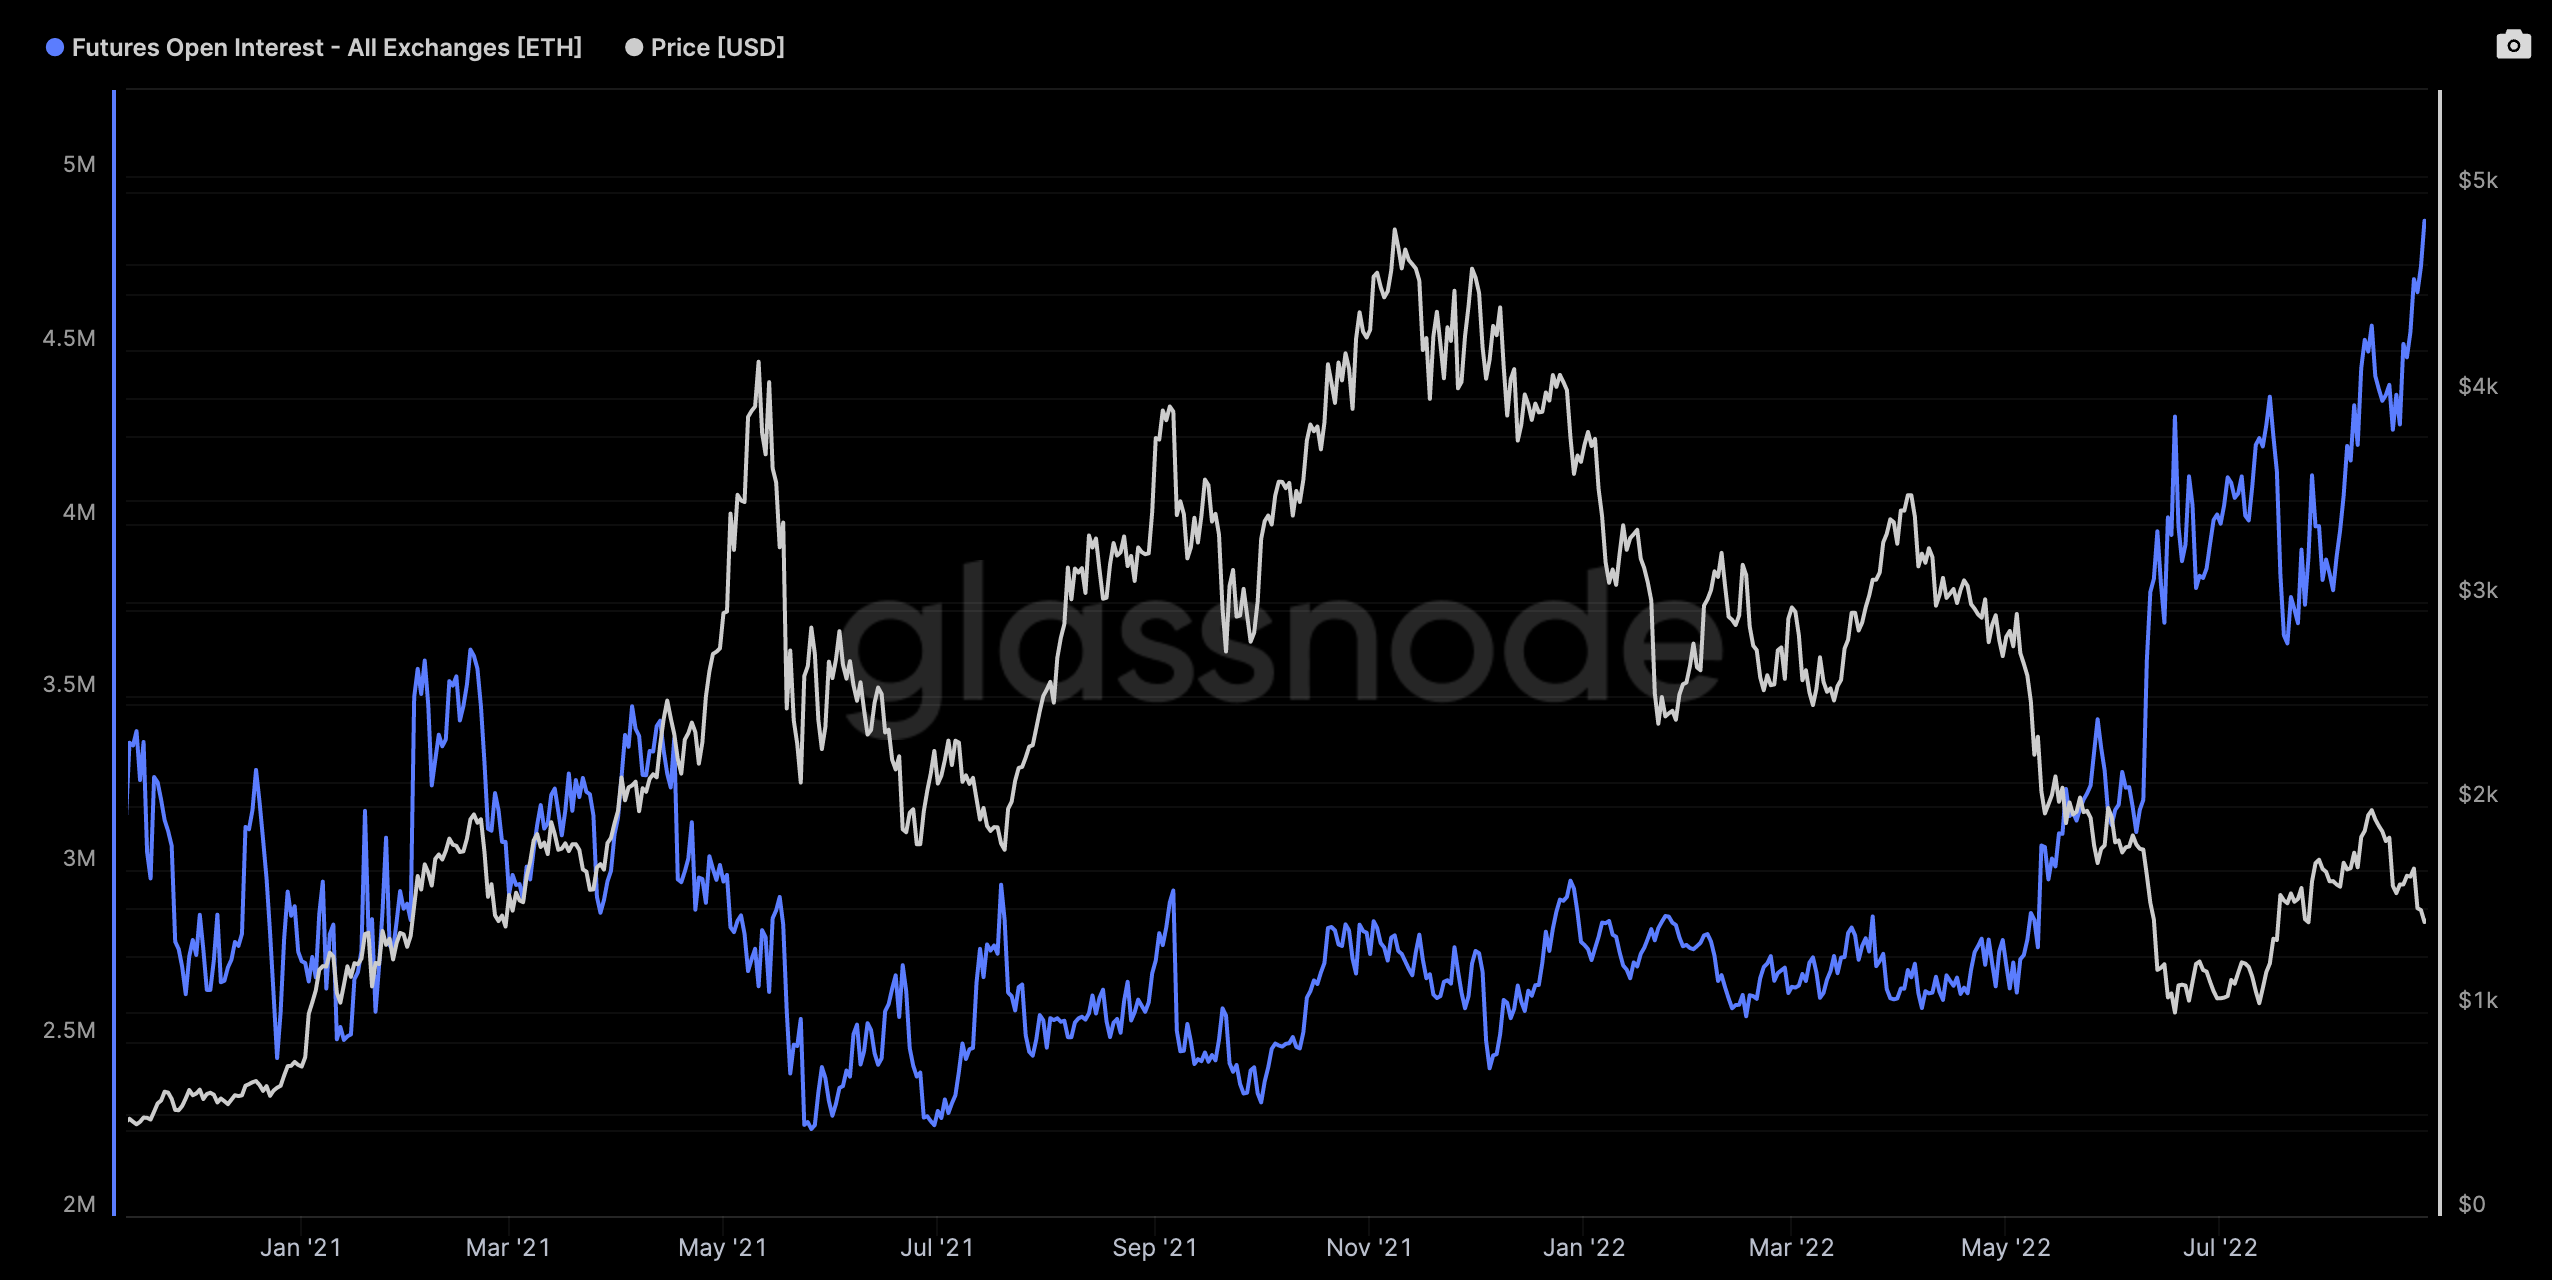


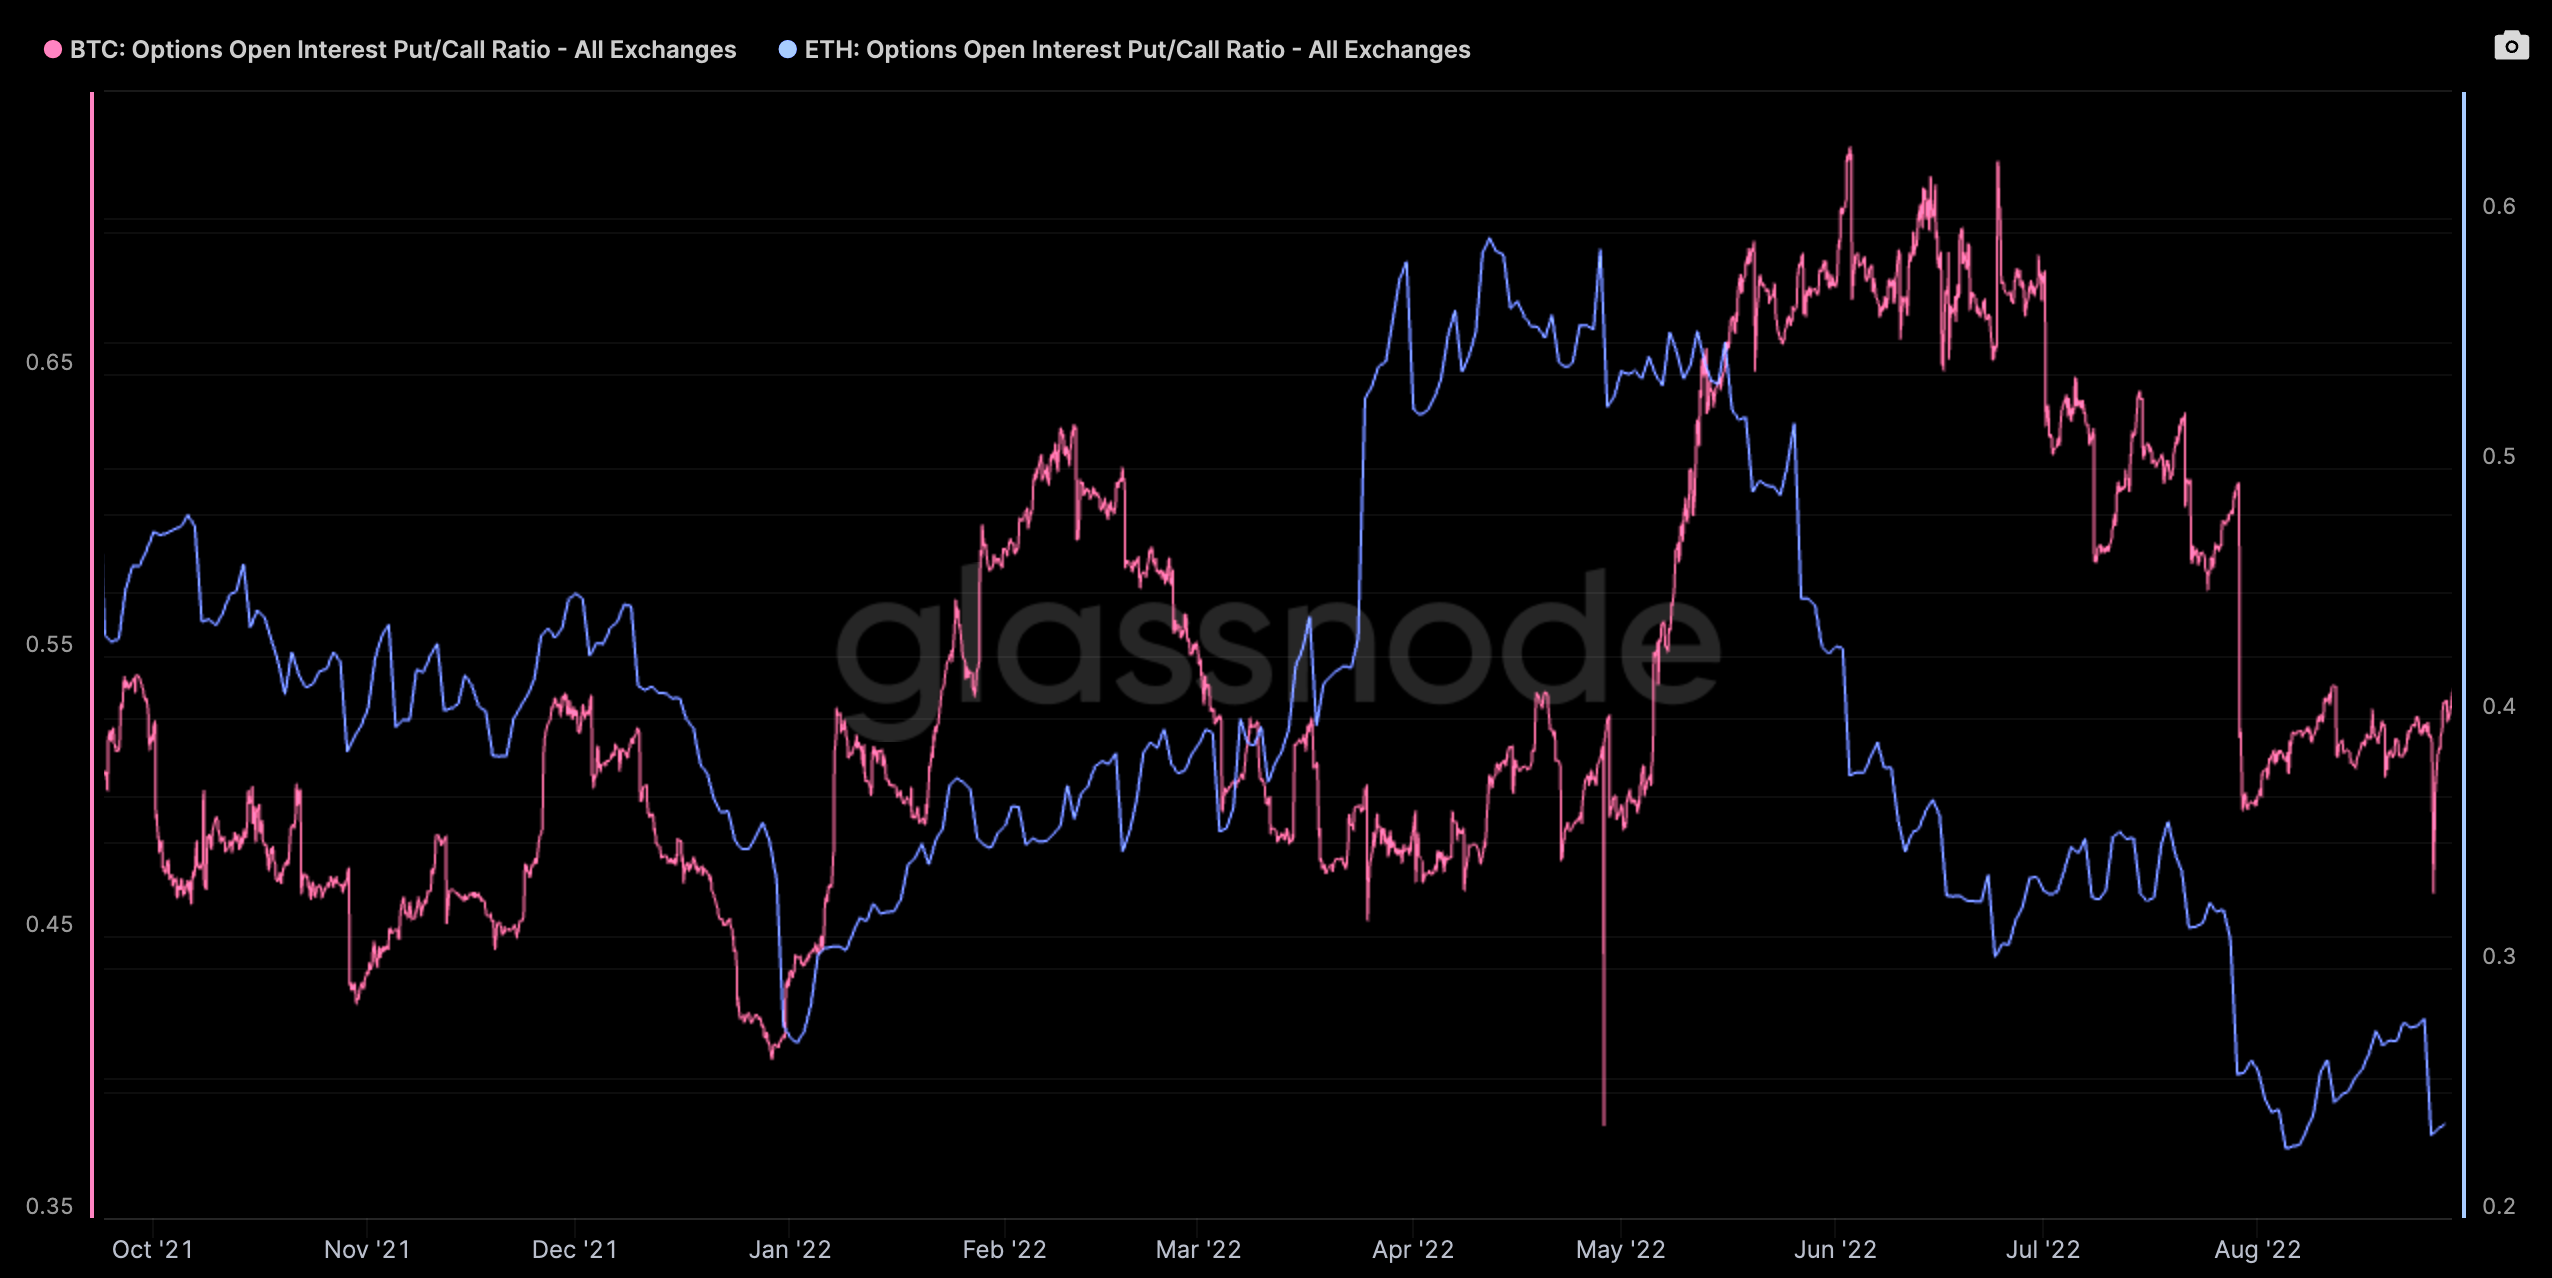
Notable surge in BTC and ETH futures OI (denominated in own native asset). Traders are becoming increasing bearish as seen in negative funding rates (ETH -0.026%). Options put/call ratio fell for ETH, increasing for BTC (divergence).
Grayscale GBTC

GBTC discount looking to widen to new ATH (-33.3%) as investors de-risk via GBTC shares on the secondary market.
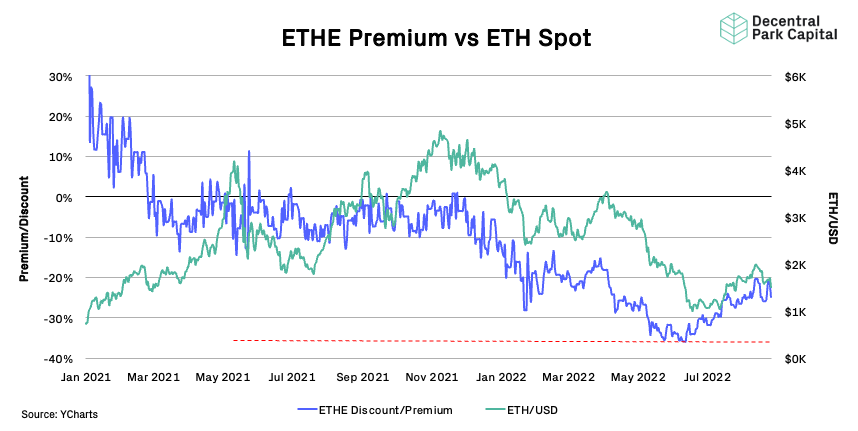
ETHE discount narrowing rejected at the -20% level and moving in line with broader spot action. Possible we see -30% discount over coming weeks.
Volumes


Daily exchange volumes peaked at $22B. Spot interest remains low and getting worse with weakening economic conditions. ETH volumes ticking up vs. lowered BTC volumes - on track for a cross over which has never occurred.

Strong support down to $19.6k and heavy resistance up to $20k. Source: Bitcoinity.
Bitcoin Hashrate

Bitcoin hash rate has increased 6% over the past week as miners commit more to the network despite weaker spot prices.
📚 ECB Sets Stage for Another Big Hike With Jumbo Move Possible [Bloomberg]
📚 How a Tribe DAO Revote Shows the Flaws in DAO Governance [Decrypt]
📚 NFT Performance Over The Past 30 Days [Nansen]
📚 Outlook of DeFi Lending [Jump]
📚 The Bear Necessities [Messari]
🎙️ The State of Crypto Regulation [Empire]
🎙️ How Strong Can The Dollar Be? [Real Vision]
🎙️ Hasu On The Future of MEV [Wintermute MEV Hackathon]
🎙️ Why Is Ethereum Trying To Maximize Value From Users? [UnChained]
🎙️Breaking Down The Future of Finance [The Scoop]
The information above does not constitute an offer to sell digital assets or a solicitation of an offer to buy digital assets. None of the information here is a recommendation to invest in any securities.