

The Weekly #185
The Weekly #185
ICYMI: Cryptoasset prices stabilize after last week's CPI print added headwinds to risk assets. On-chain and off-chain indicators highlight low conviction on bullish breakouts near-term.

We have had reports from Substack that of our readers did not receive The Weekly #185. ICYMI: #185 highlights some of the soft market signals and marcro headwinds we were paying attention to heading into ETHDenver week.
Rate Hikes And Aggression
Global markets creep back below $2T as investors appear to extend their ‘wait and see’ approach. The key macro event last week was the key US inflation measure released on Thursday that showed prices are climbing at the fastest pace in 40 years.
CPI climbed 7.5% YoY in the month of January (6% excluding energy and food). This was above wider expectations as Americans paid for higher prices for an increasingly wide range of goods, including food, energy, and shelter.
Higher than market expectations and reports indicating inflation affecting good beyond those related to the pandemic will force policy makers to react more aggressively.
There may even be an intra-meeting rate hike.
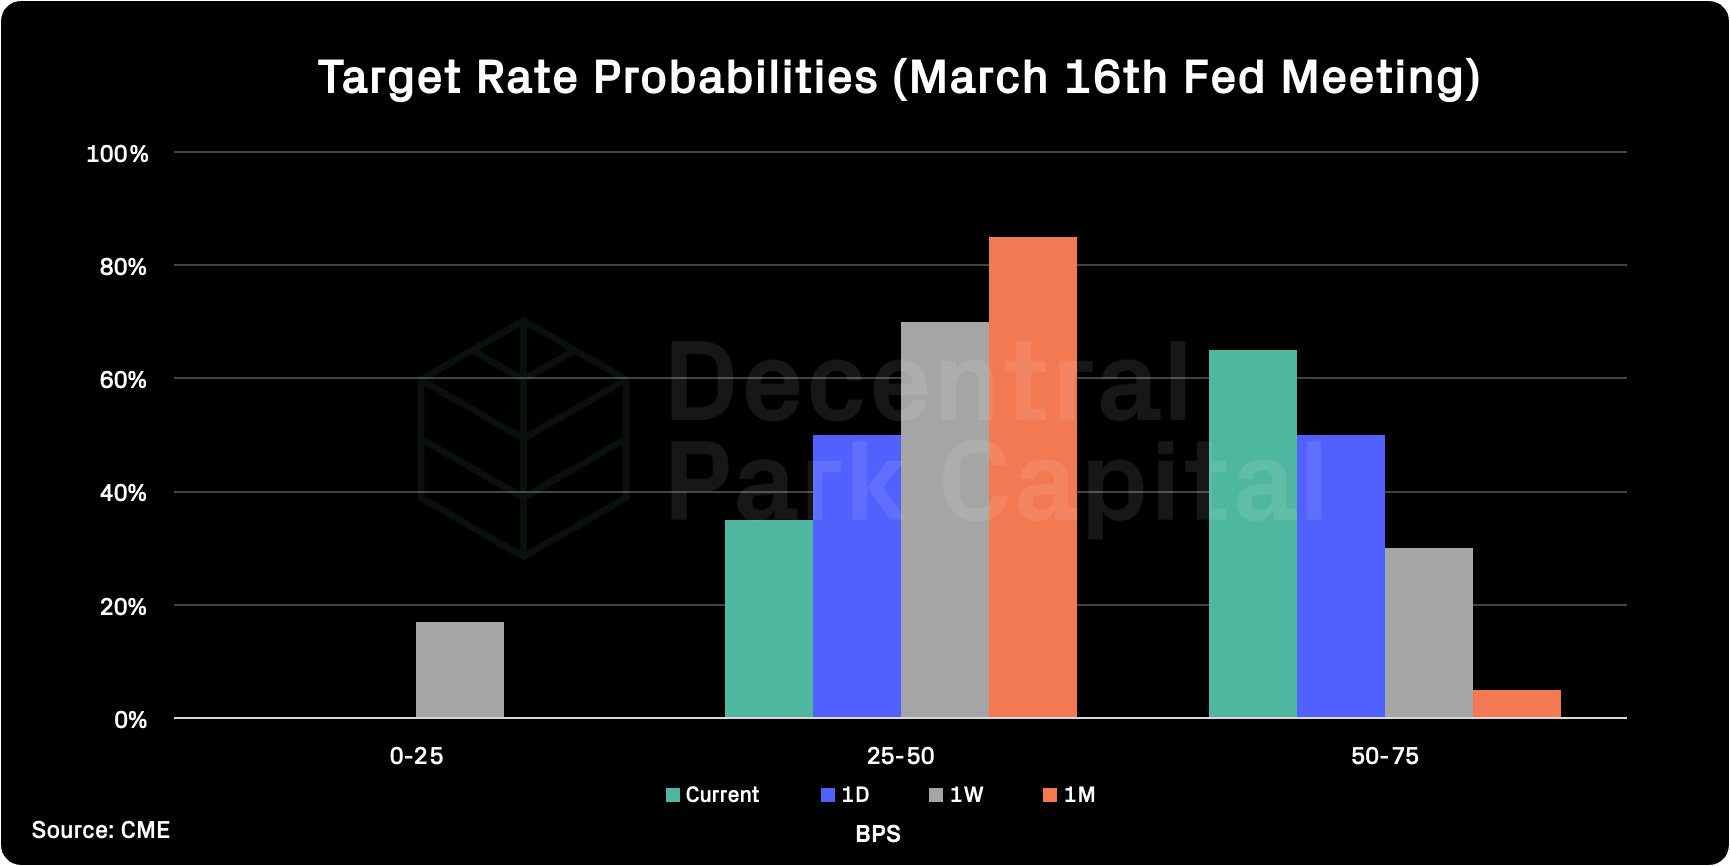
The CME Fed watch shows that compared to just 1 month ago, the probability of a single March rate hike of 50BPS and above has increased from <40% to >60%.
BTC Leading The Market?
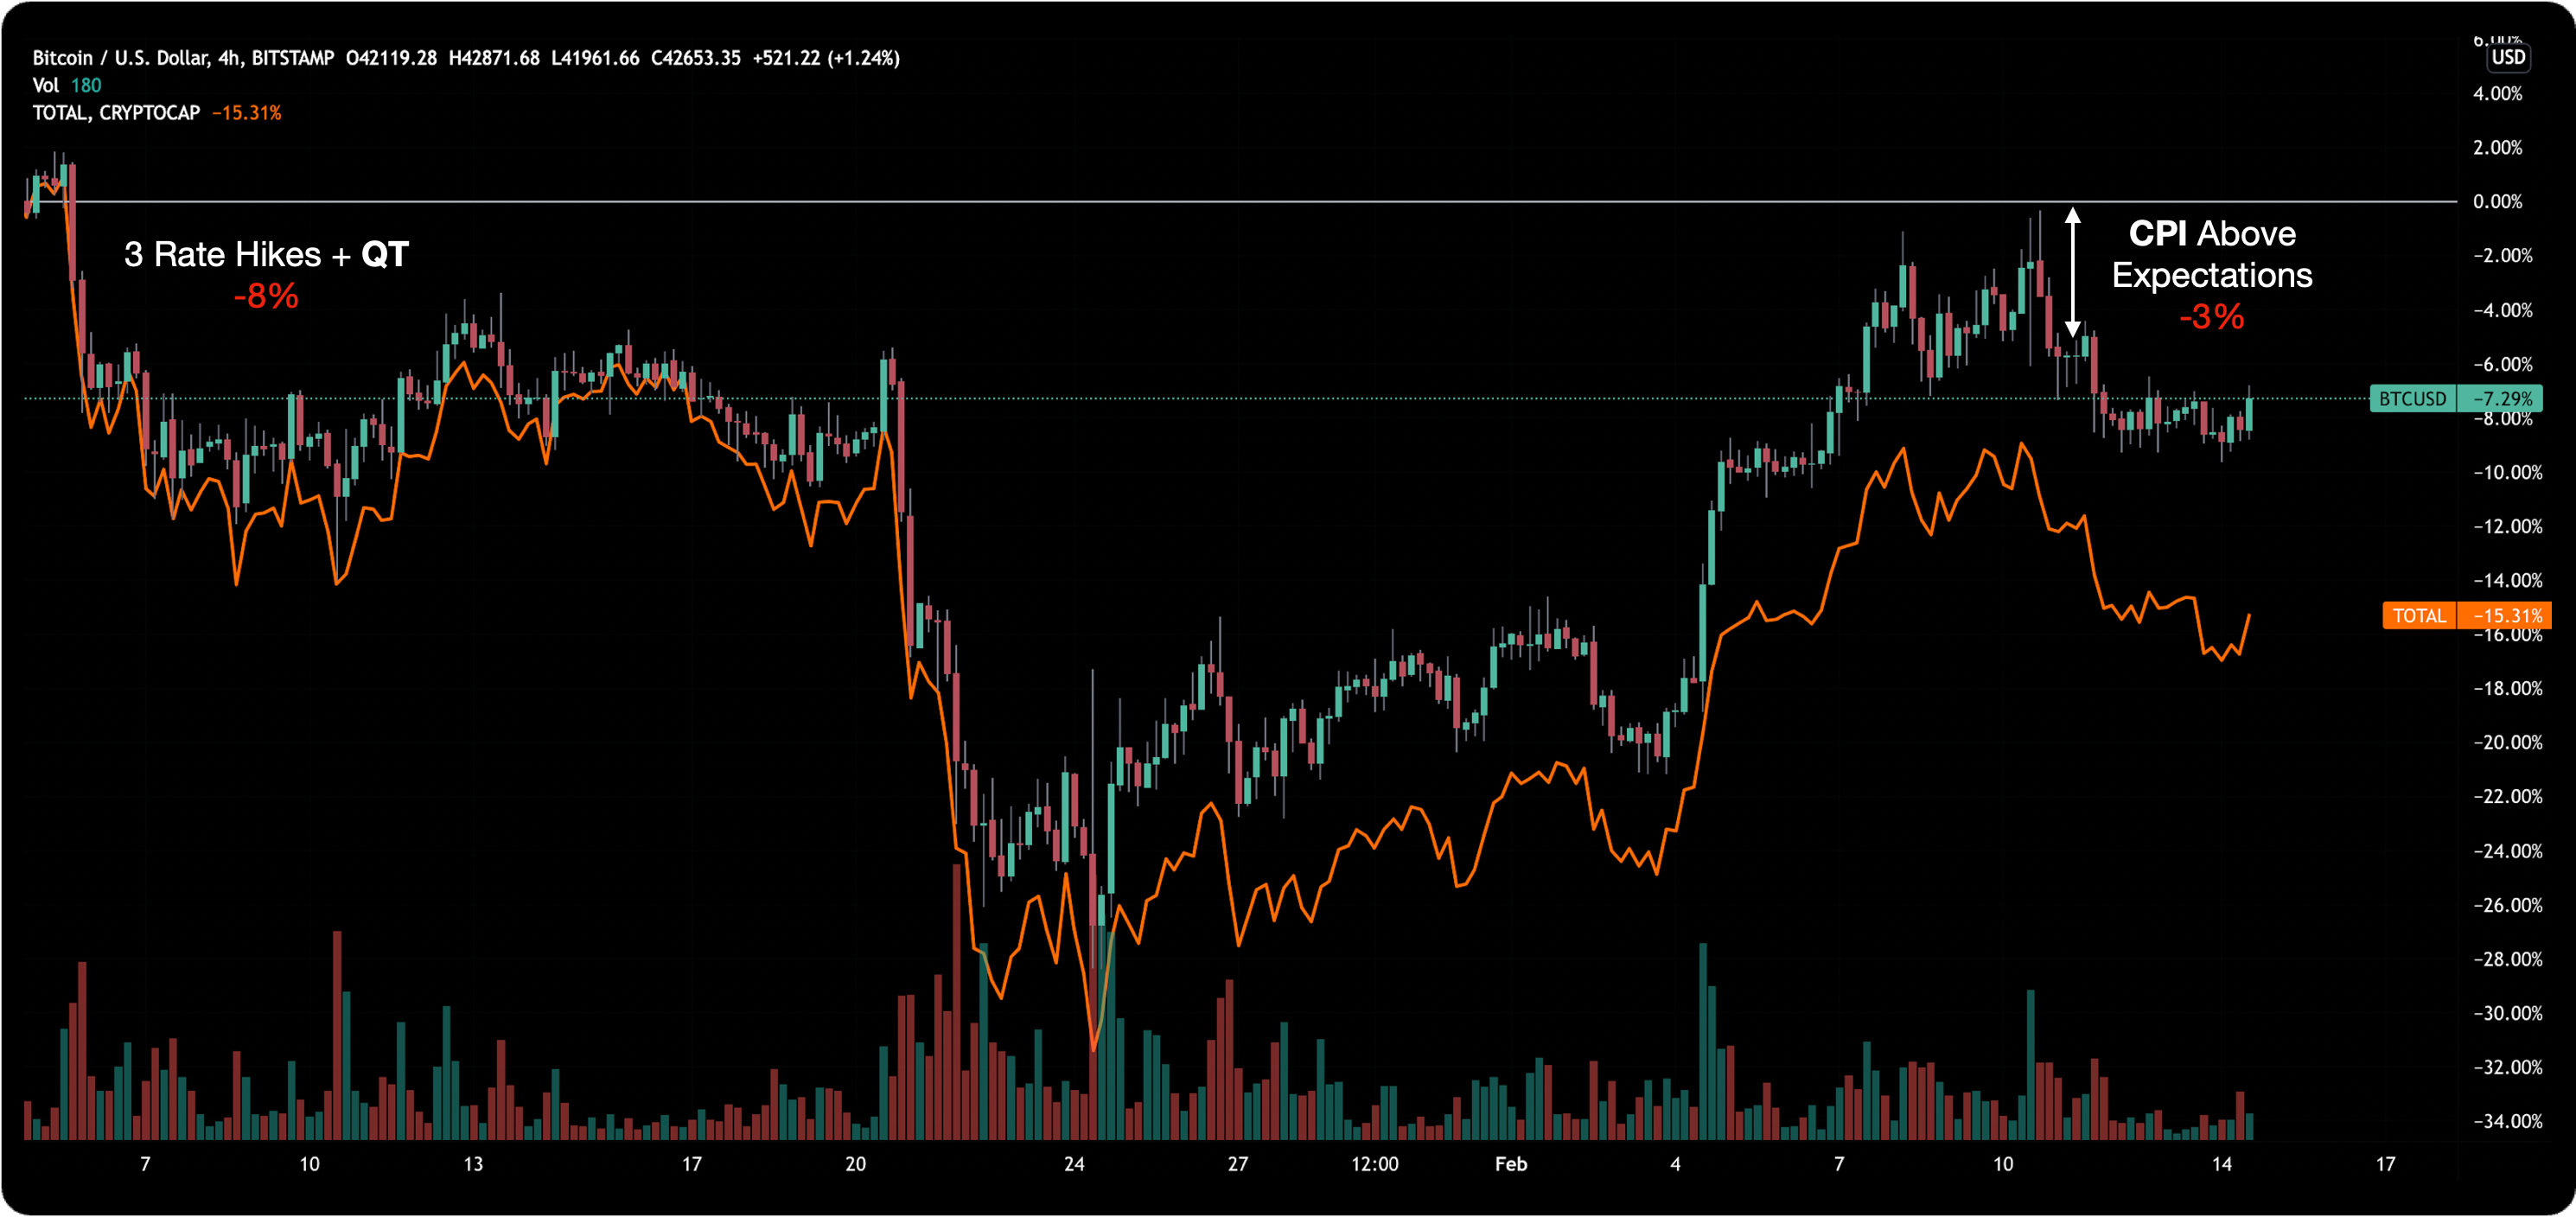
Risk assets including crypto tumbled (~3% for BTC) in the days after the CPI print. However, this is markedly lower than the drawdowns (-8%) seen in the days after The Fed first indicated their aggressive policy stance including the introduction of QT.
It would be that these headlines now impact crypto markets less as the bandaid has already been ripped off. What’s more is BTC has outperformed the wider market since the QT news in January by ~7% although down in absolute terms (-7%).
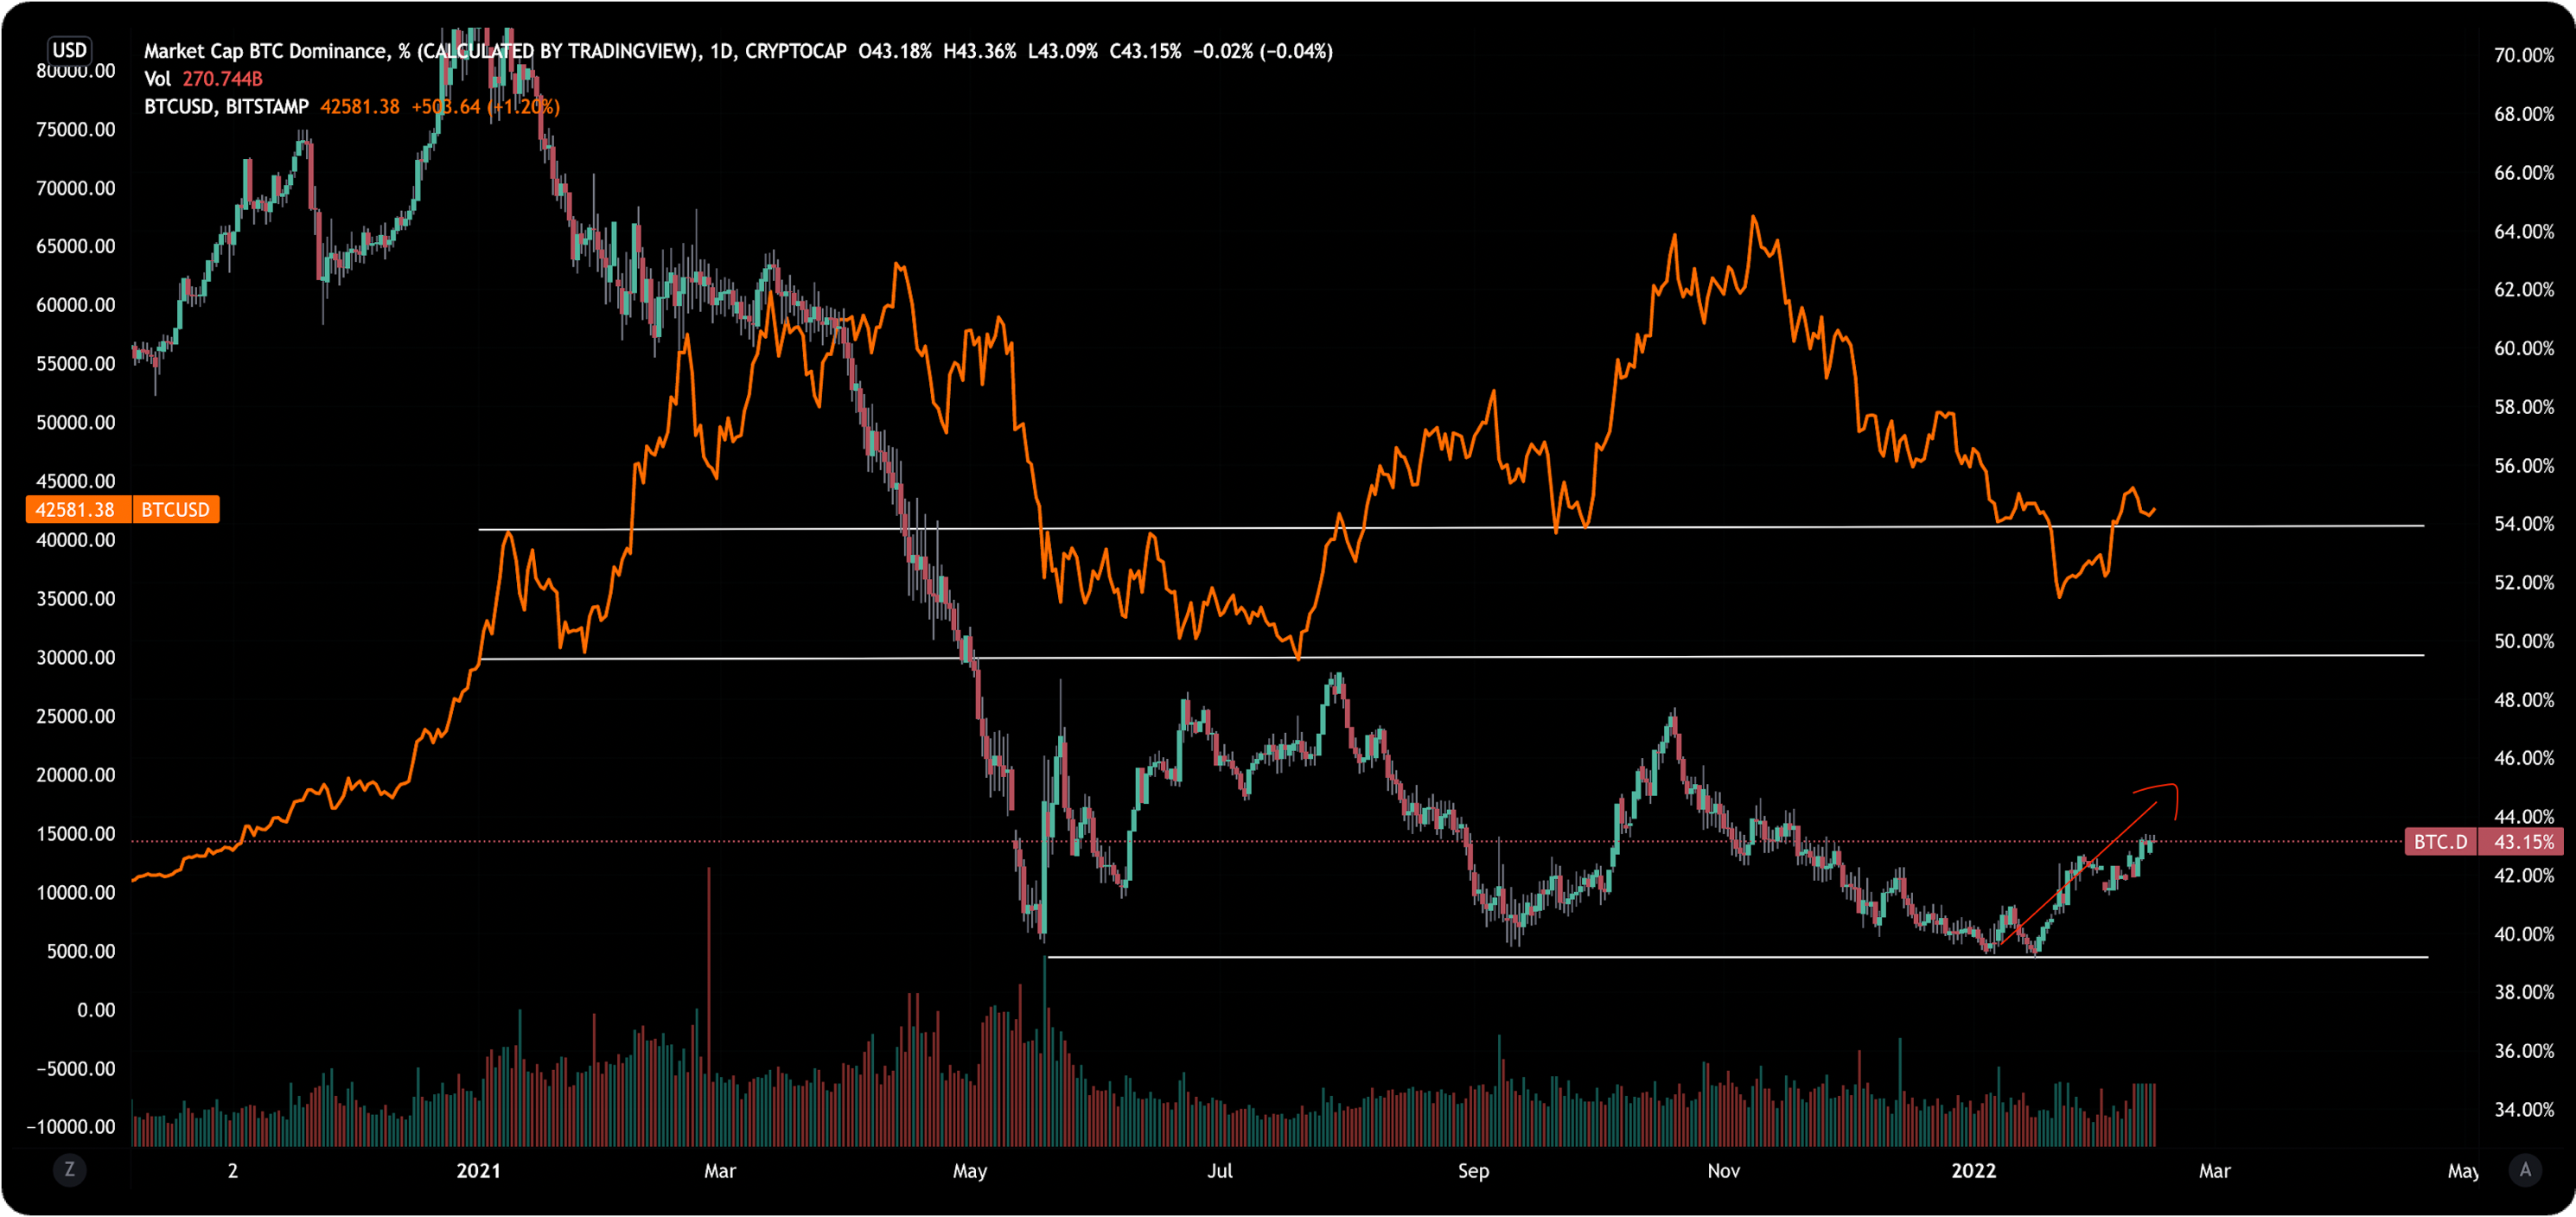
Digging further, BTC’s dominance is approaching a 3 month high of 43% as the orange coin is stabilised above $41k.
This recent BTC led rally comes with no dominant narrative but as we highlight in previous editions, narratives around payments (i.e. lightning) and inflation-hedge/sound money are still very much on the cards.
Ongoing geopolitical events including the Ukrainian-Russian tension could fuel the latter over the coming months.
Uncertainty On Near-Term Bullish Action
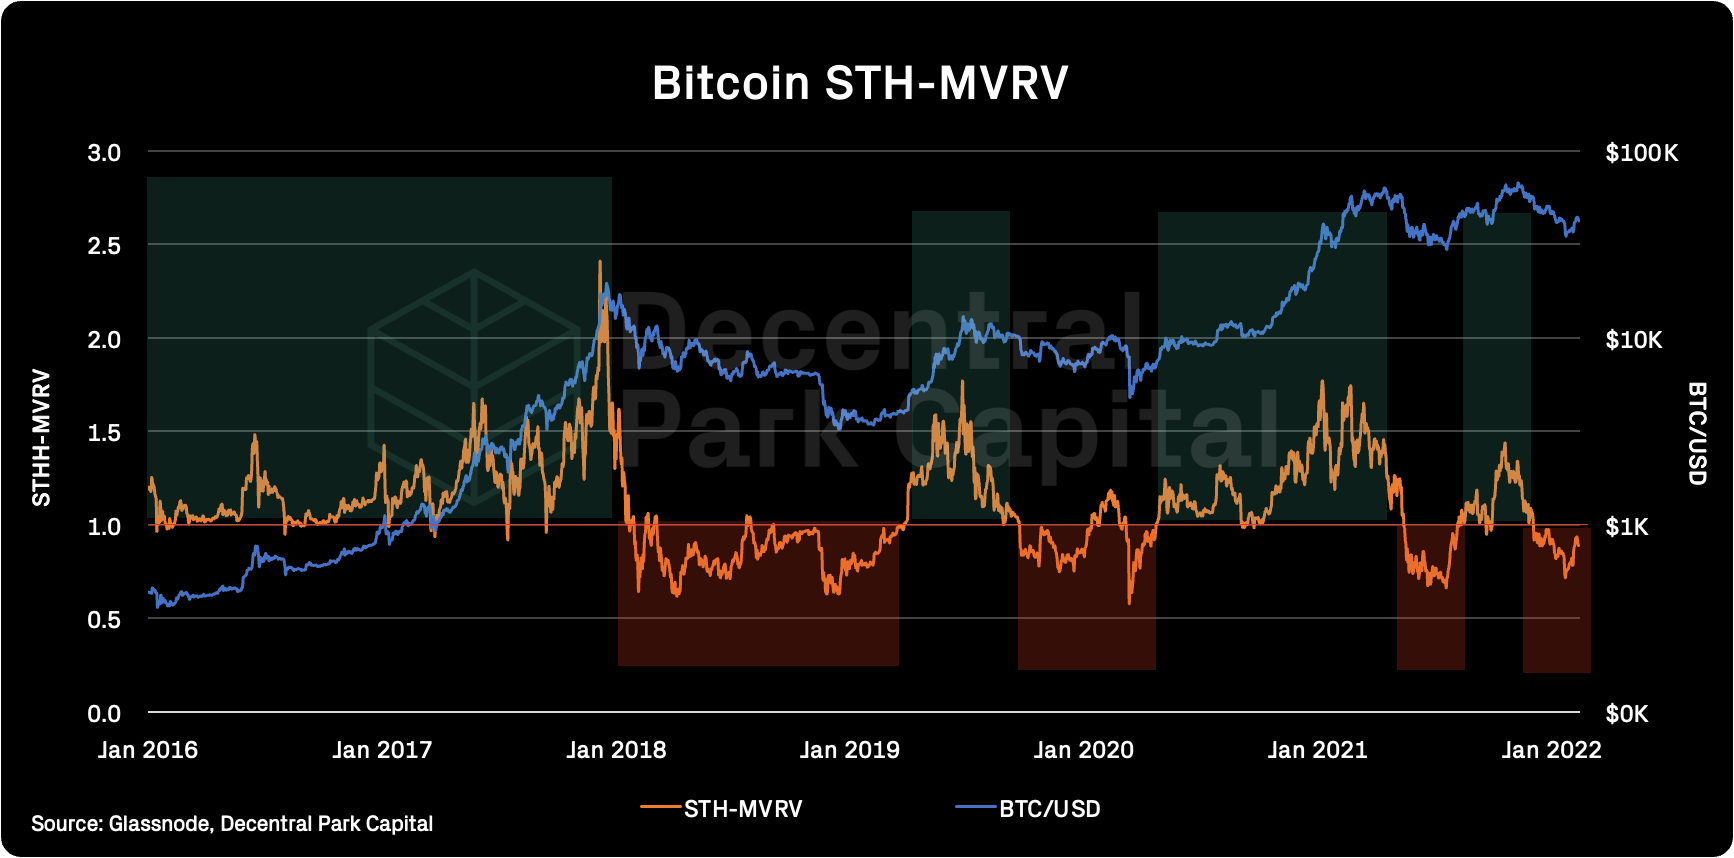
While BTC’s dominance looks to trend up, it is worth looking at signals that point to performance in absolute terms. On-chain metrics around short-term holders still look bearish overall with the STH-MVRV yet to show that demand can outstrip short-term selling (>1).
From this perspective, short-term holders seem to be uncertain about near-term bullish price action.
Over in the futures market, Bitcoin OI continues to fall from the 400k BTC highs in November 2021 to 340k BTC (-15%). Over the last week, this fall is OI has diverged to price. Investors appear to be deleveraging perhaps until there is some clarity around the FOMC meeting in March.
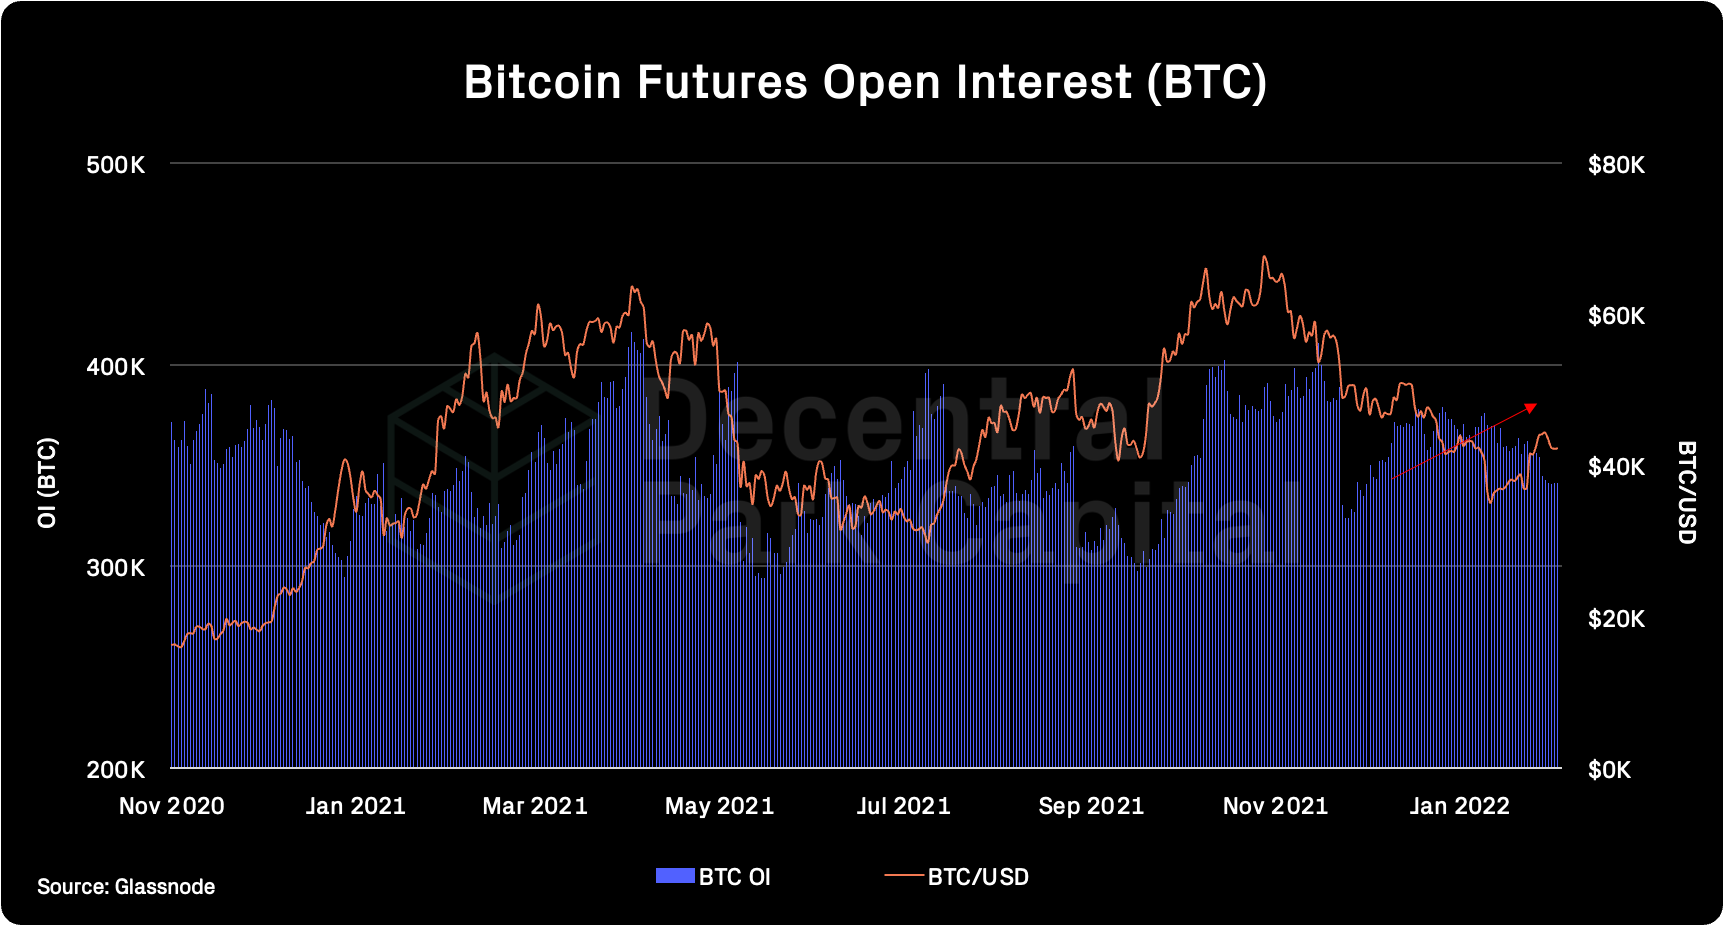
The ratio of Bitcoin’s OI to market capitalization shows the degree of divergence which is approaching multi-year lows of 1.6%.
OI/MCAP tends to ramp up for several months after reaching this arbitrary floor where leveraged flush out events occur both on the upside and downside.

Muted Interest More Widely
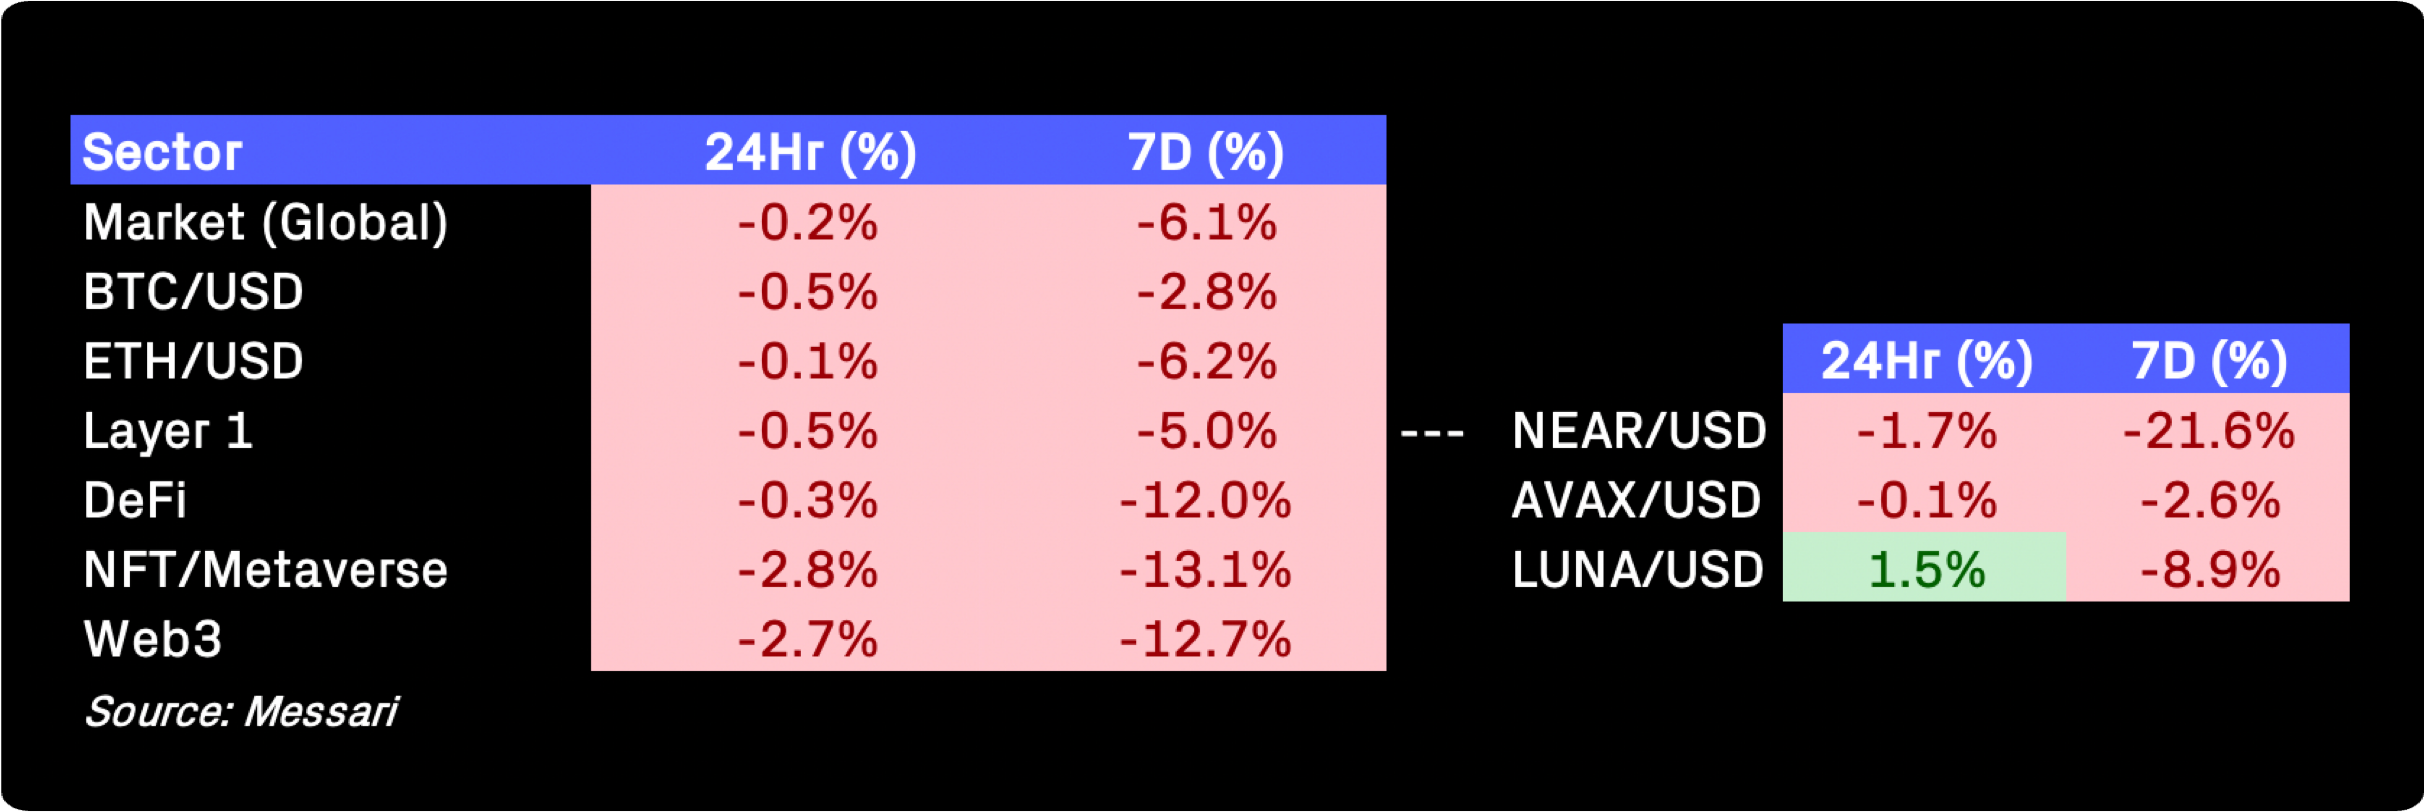
No asset bucket has been immune from the moderate sell offs over the past week although there has been some dispersion. An index of Layer 1s (-5%) have outperformed DeFi (-12%), NFTs (-13%), and Web3 (-12.7%).
There is also some dispersion within buckets themselves. NEAR continued to be sold off hard but has found good support at $10. Meanwhile LUNA manages to stay above its 200d MA with a wide range of Terra projects looking to launch in February/March likely helping to maintain interest in Terra’s native cryptoasset.

Top performing assets are are mostly retail-centred assets indicating some pulses of interest from those market participants on select assets.
Global (7d%):
Smooth Love Potion (+110%)
XRP (17%)
LEO Token (+15%)
Elron (+14%)
Kadena (+11%)
DeFi (7d%):
Nest Protocol (+5.4%)
Band Protocol (+3.4%)
Wanchain (+4.3%)
Ren (+0.4%)
Kyber Network (+0.3%)
CowSwap
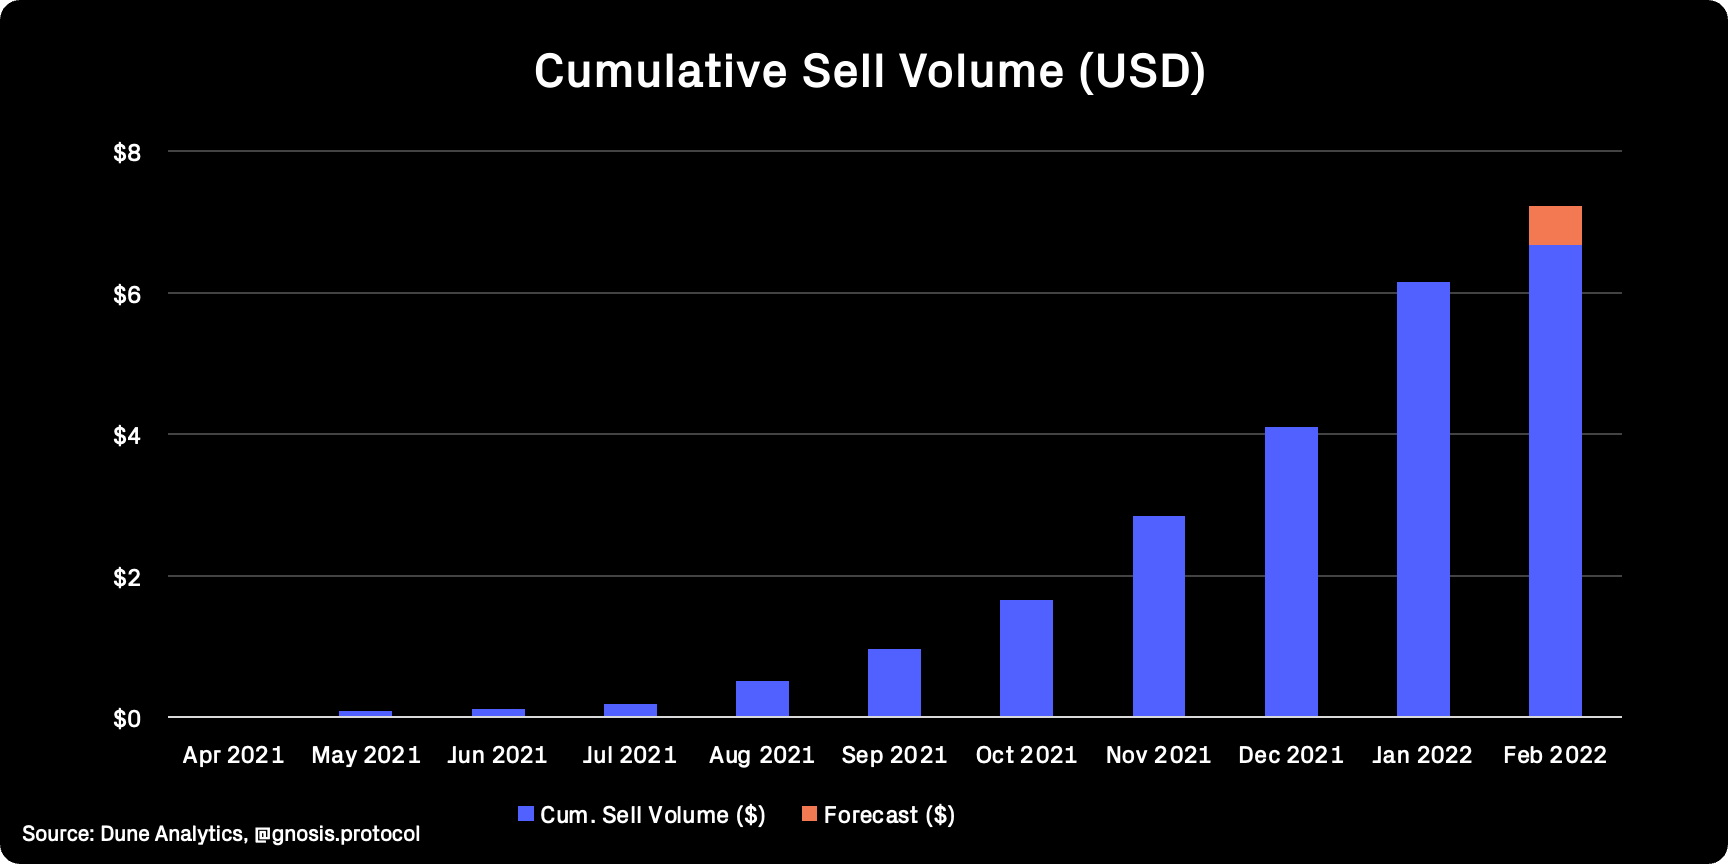
Gnosis V2’s flagship app, CowSwap, continues to move from strength to strength. The DEX aggregator has facilitated a total of $6.67B to date with February forecast to reach over $7B at current pace (17% MoM growth from January).
CowSwap has printed a 82% average MoM growth rate over the last 6 months.
Lightning Network
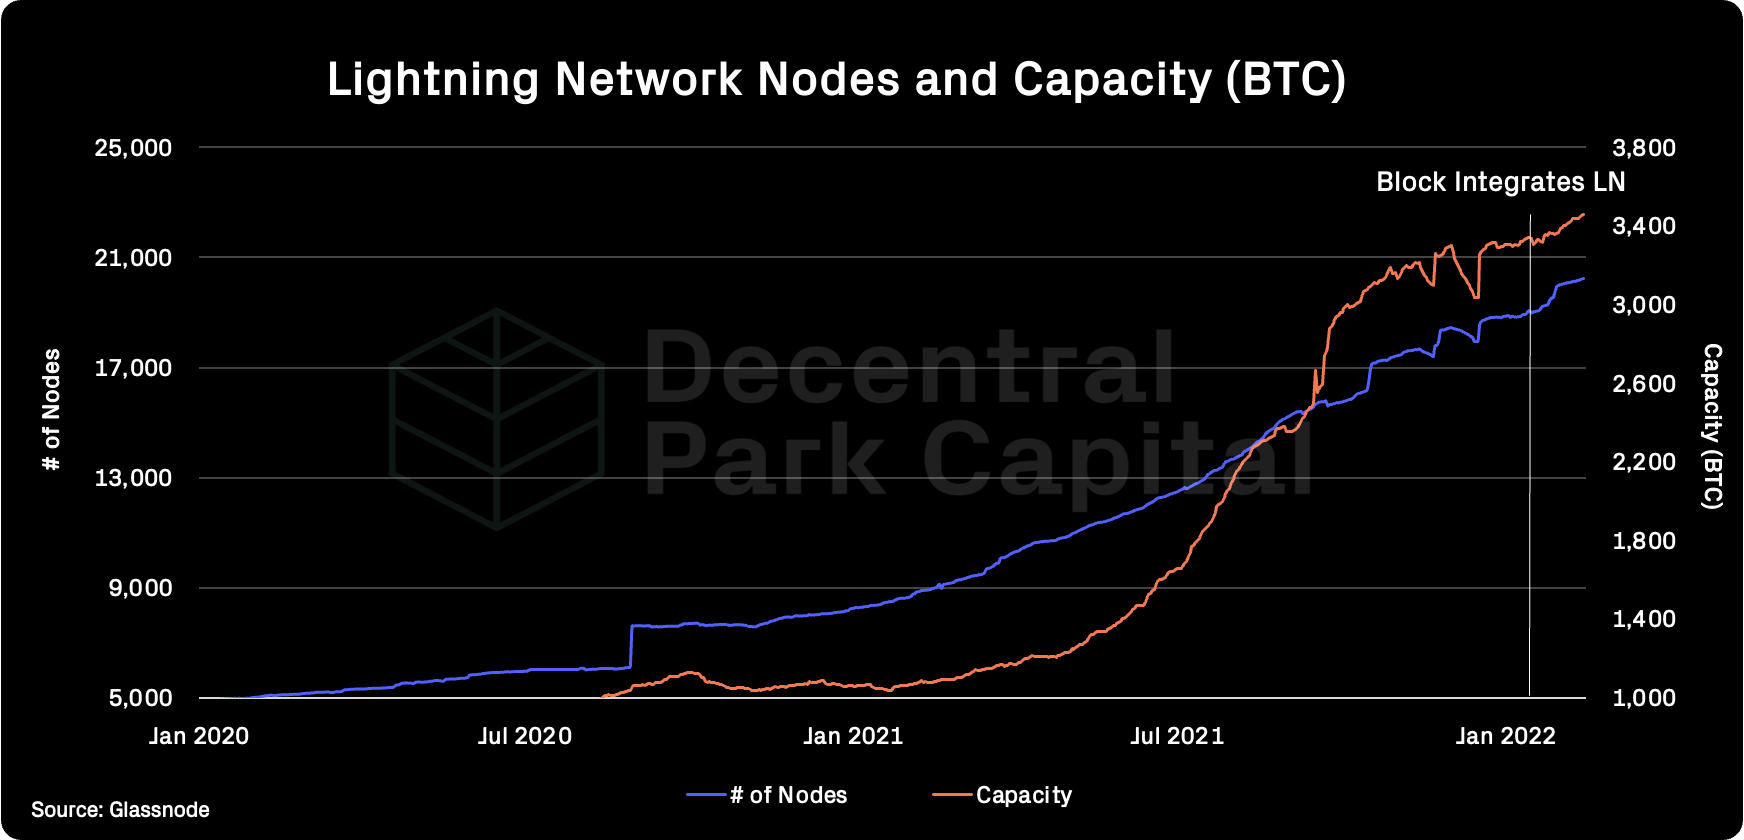
Lightning network core stats make new ATHs. Lightning now has over 20k nodes and over 3,400 BTC ($146m) locked within in its channels.
There has been a slight acceleration in growth in recent weeks which corresponds to Block’s integration of LN within its app.
Frax Price Index (FPI) airdrop snapshot will likely be taken on February, 20 4PM PST. The balances eligible are veFXS, staked FRAX-FXS LP, and tFXS in Tokemak.
CVX lockers were rewarded with $0.5 of bribes per vlCVX during the last voting round (51% APR).
Andre Cronje's Solidly Exchange is live on Fantom, LPs will be receiving rewards from gauges according to votes, bribes are supported. Token is not trading yet.
Futureswap's reward distribution account was exploited. The team had to migrate FST contract on Arbitrum to a new address. FST contract on Ethereum is intact.
Perpetual Protocol will allocate PERP liquidity mining rewards on a per market basis starting from February, 14. Each market is allocated 5k PERP per week.
DeFi’s blue chip platforms must shed their degen cocoon and fit in the regulator’s box in order to go mainstream. Once they cross the chasm, its game on for all asset classes.
The all out global blitz on sports franchises comes to a head Super Bowl weekend, as crypto invades every living room and every fantasy league. Its working.
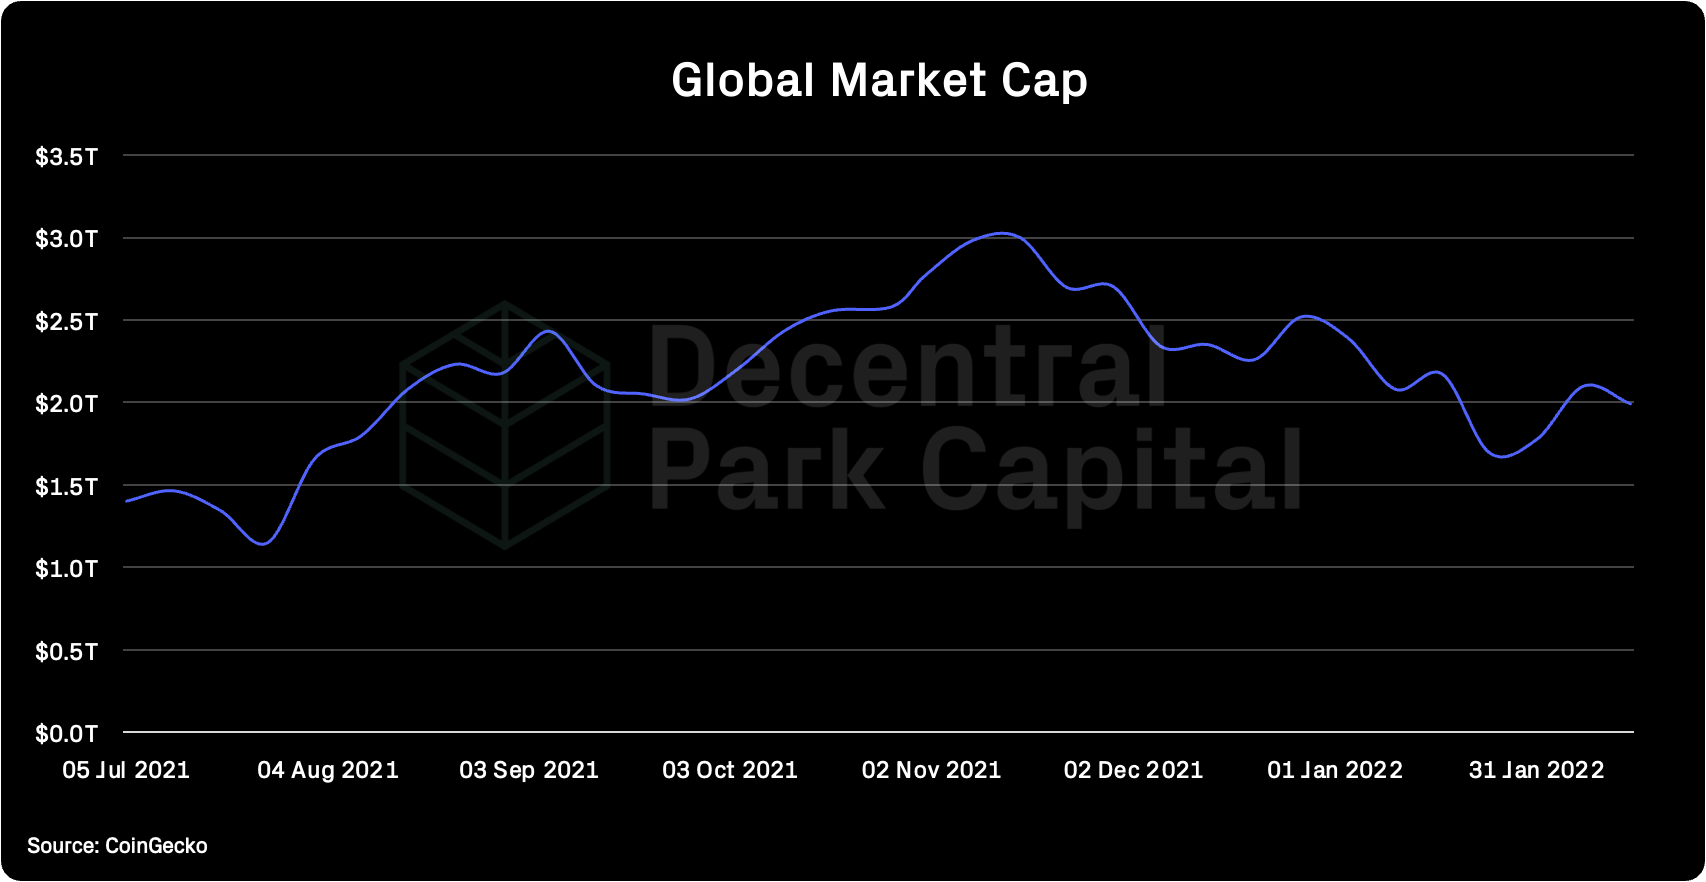
Global market cap: $1.99T; Global market cap has fallen by 6% and still down 8% over the past 30 days.
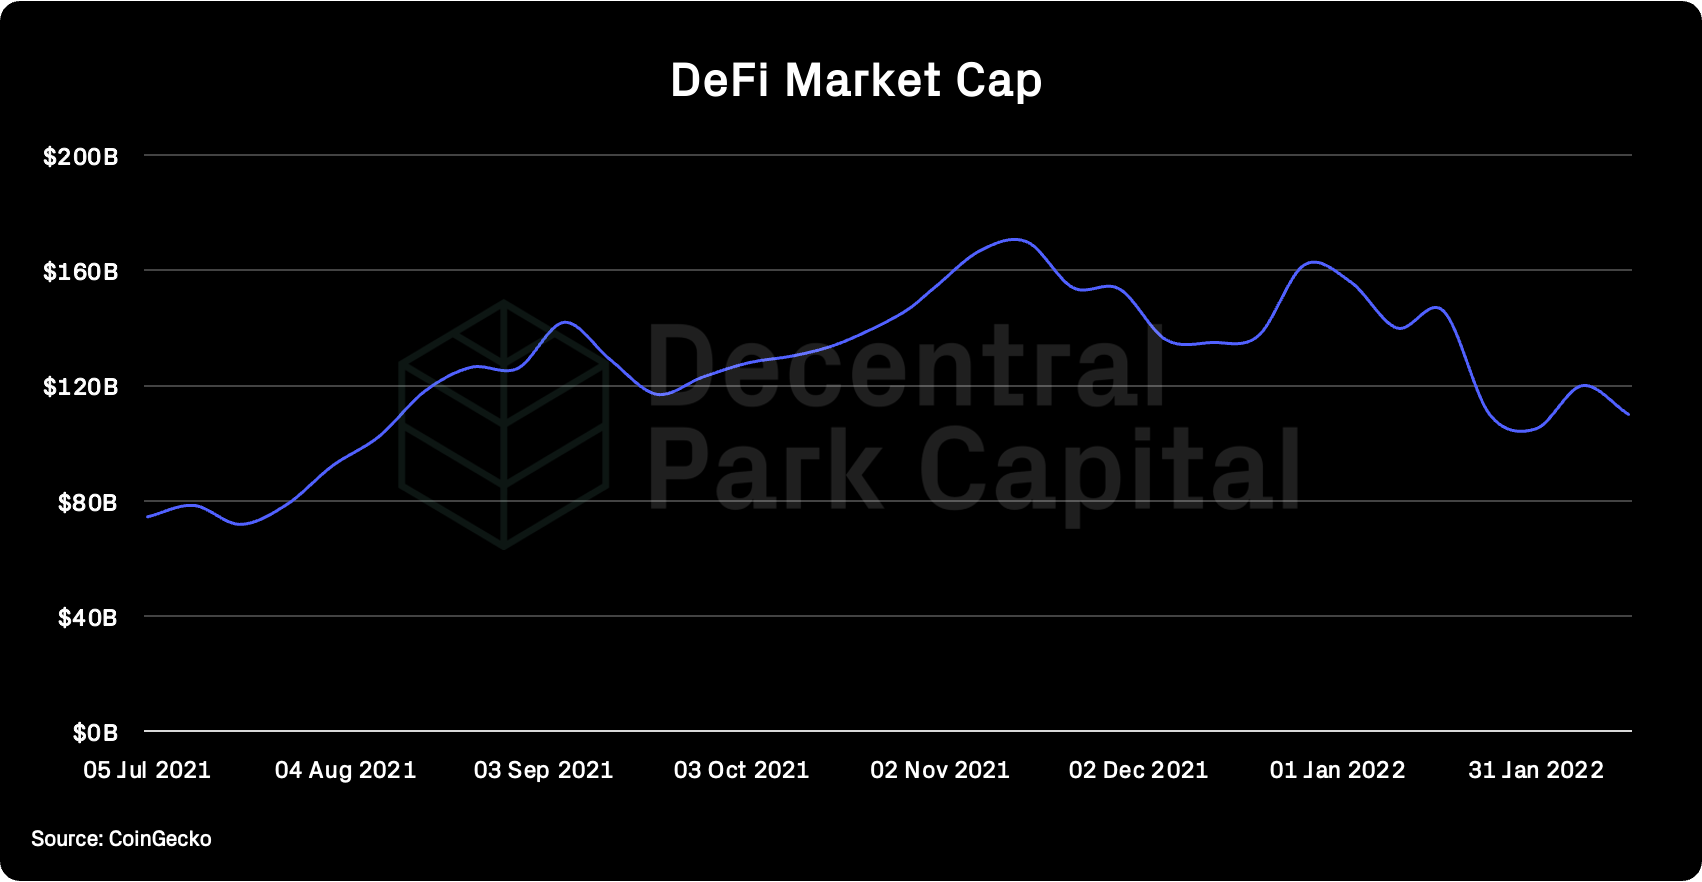
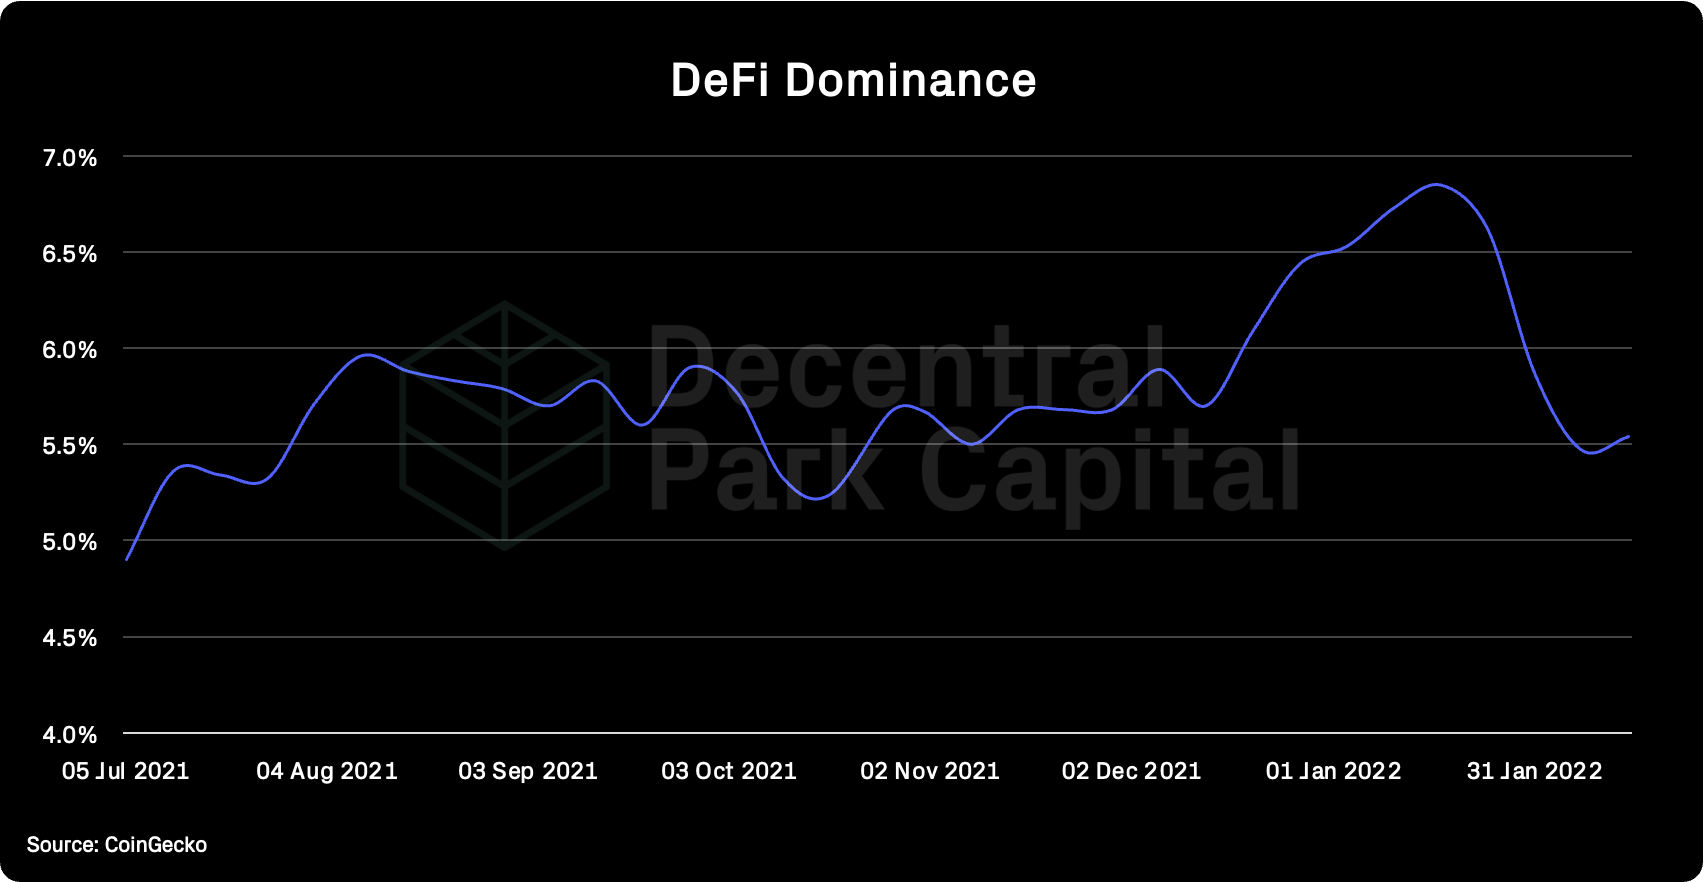
DeFi: $110B; DeFi market cap has fallen 8%, slightly more than global MCAP. DeFi dominance stayed relatively flat over the same period.
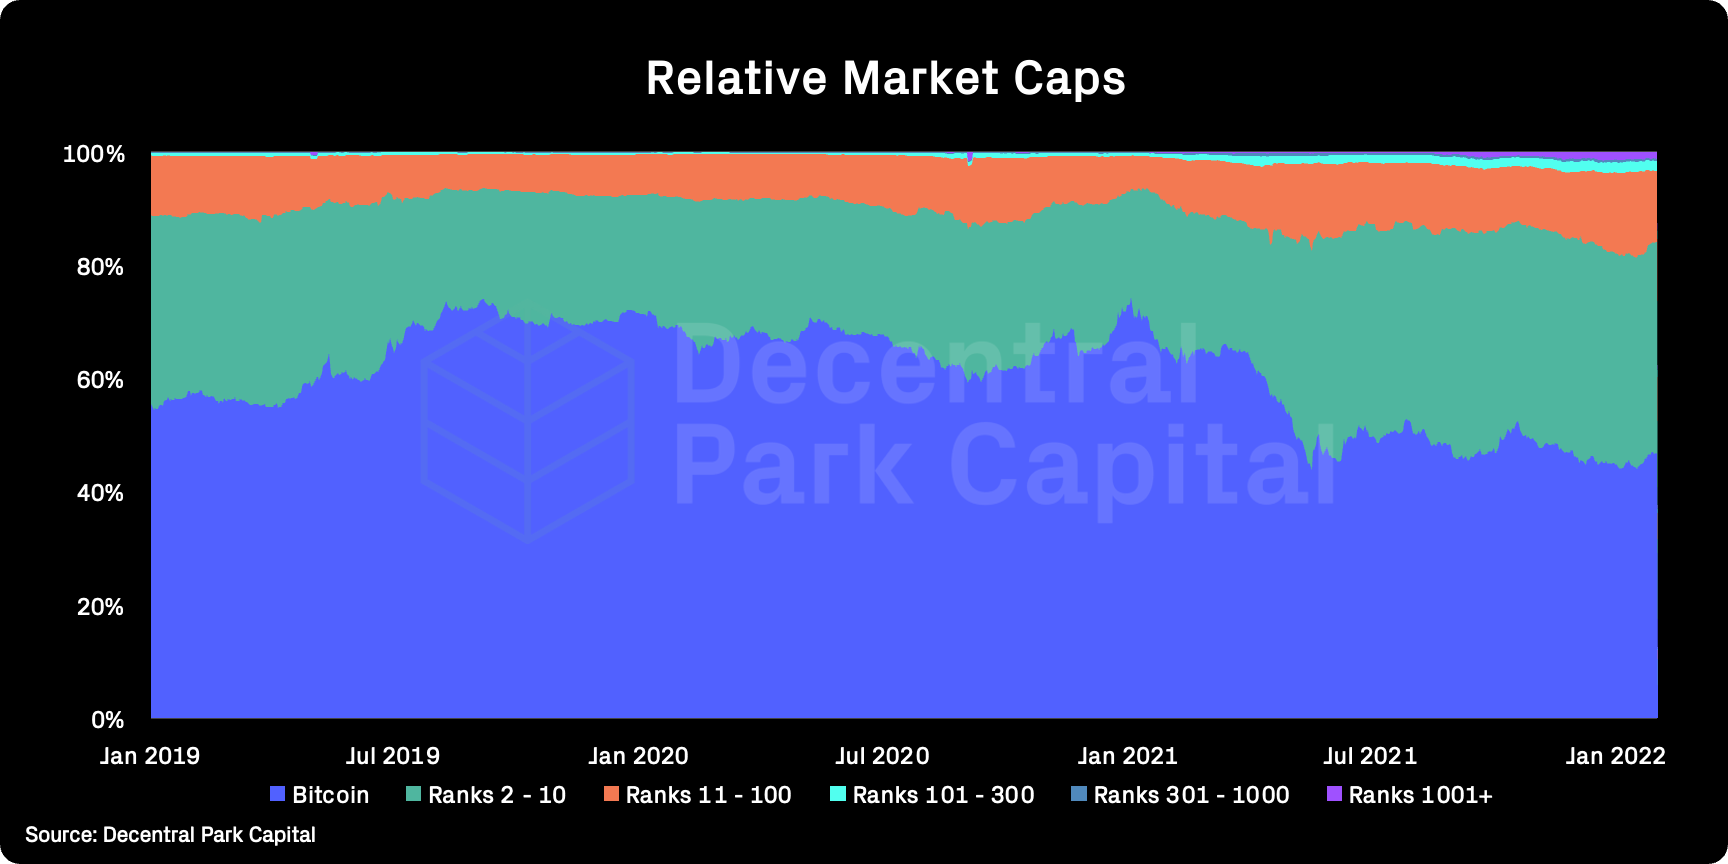
Market shares; Bitcoin dominance has increased to 47% as L1s and mid-cap names underperform relative to the orange coin.
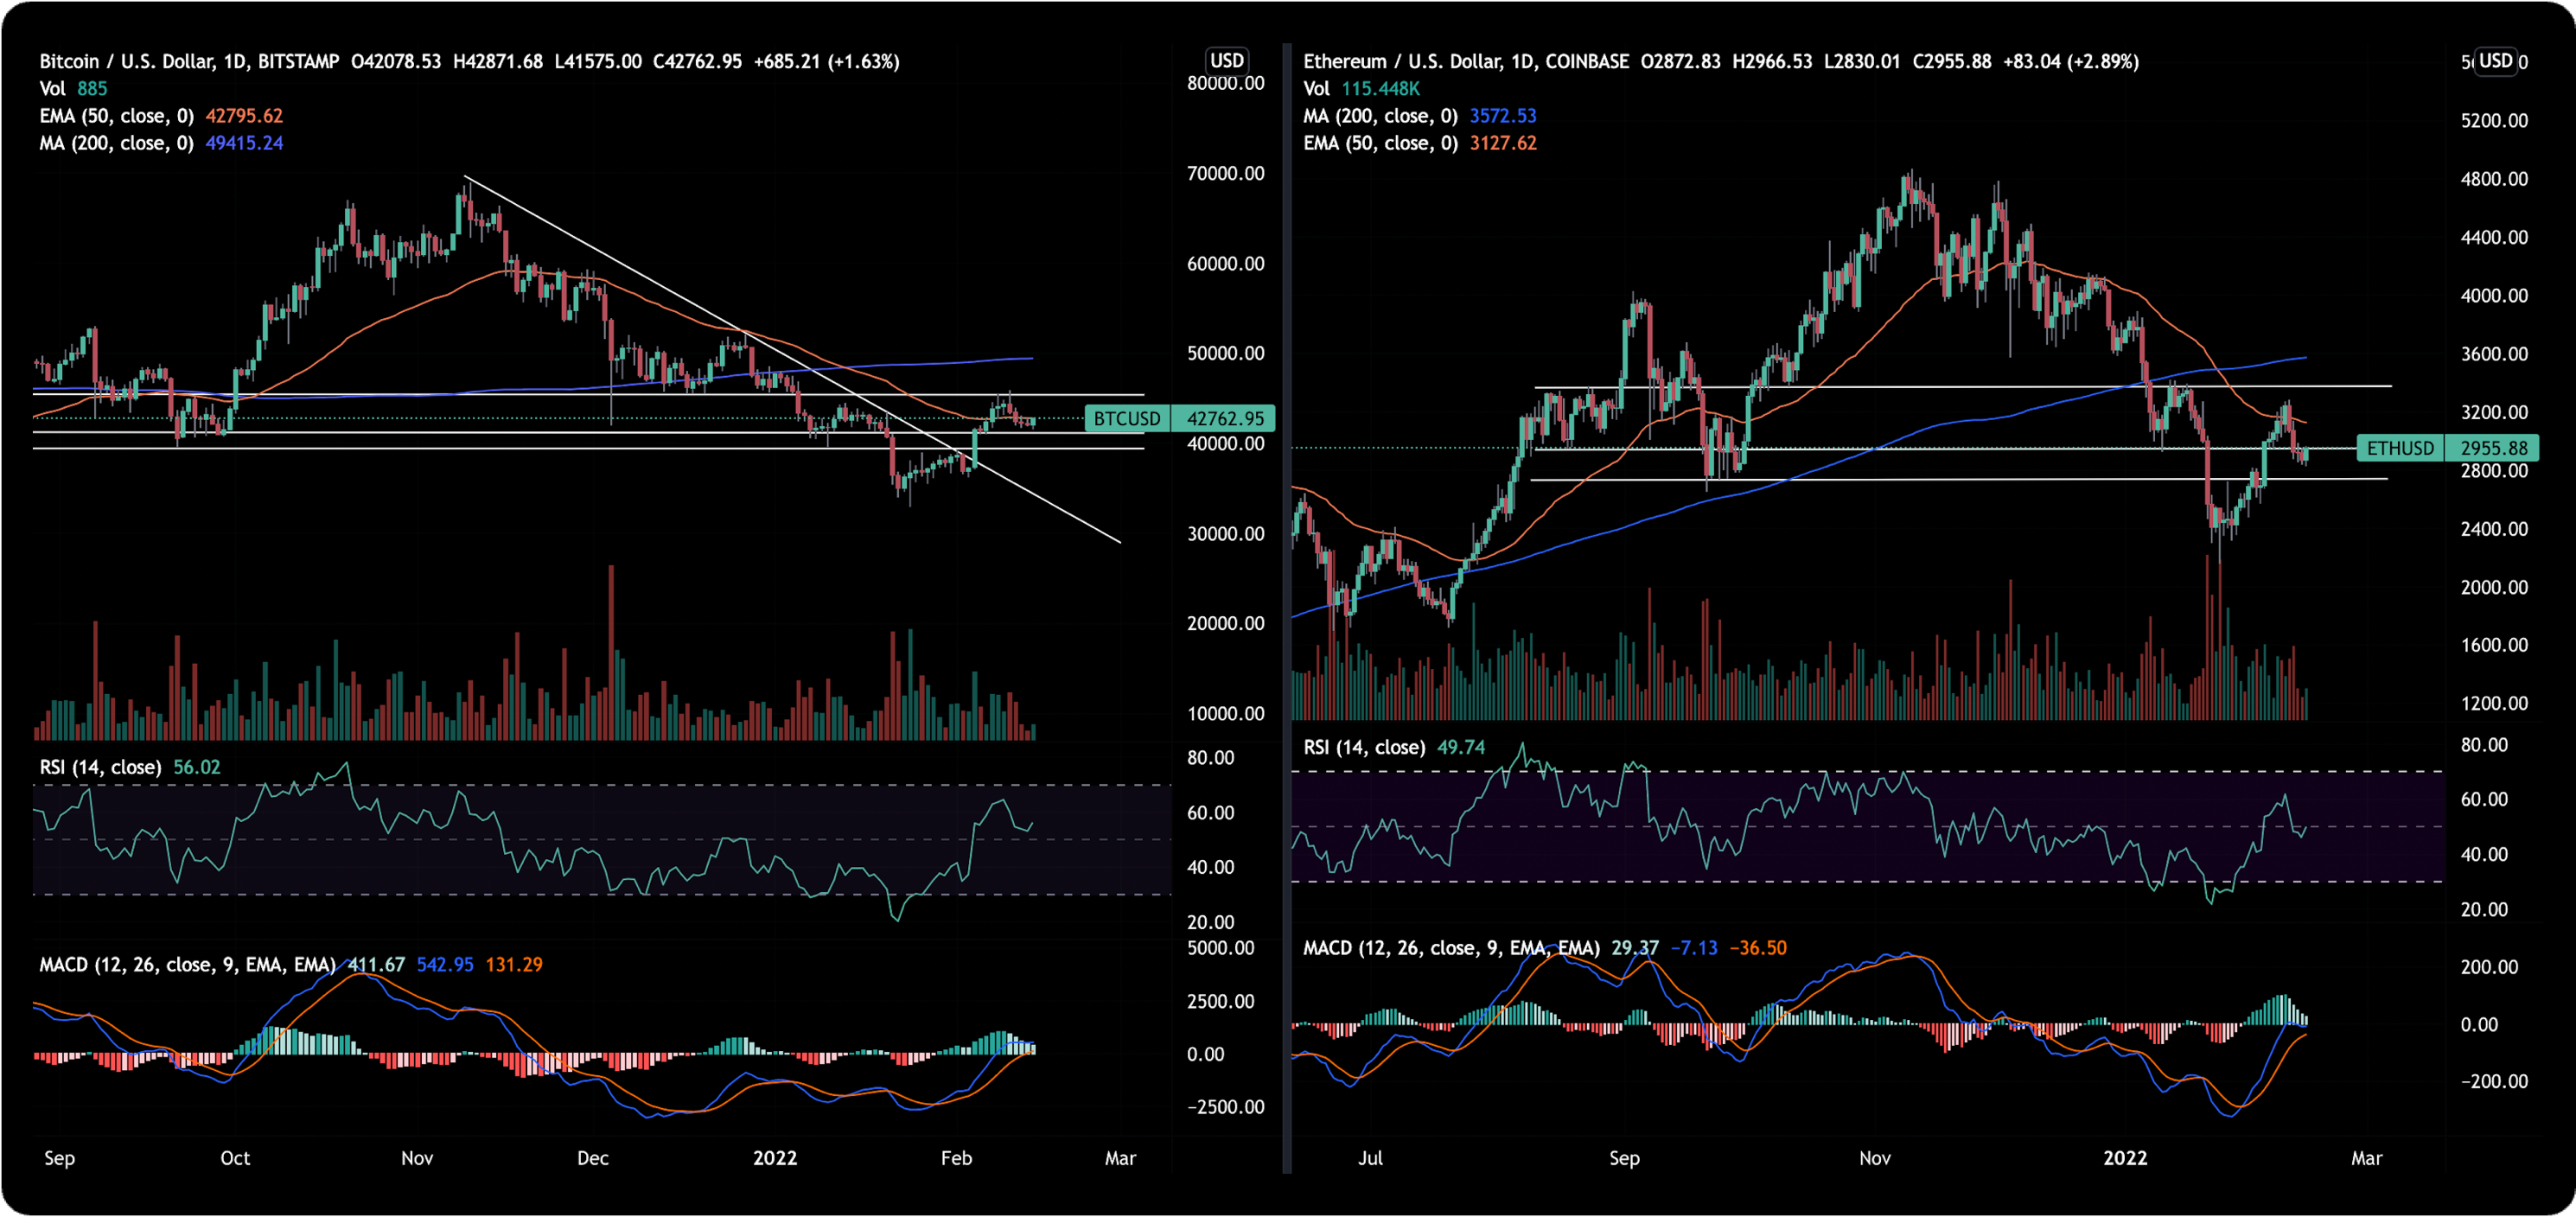
BTC/USD
ETH/BTC
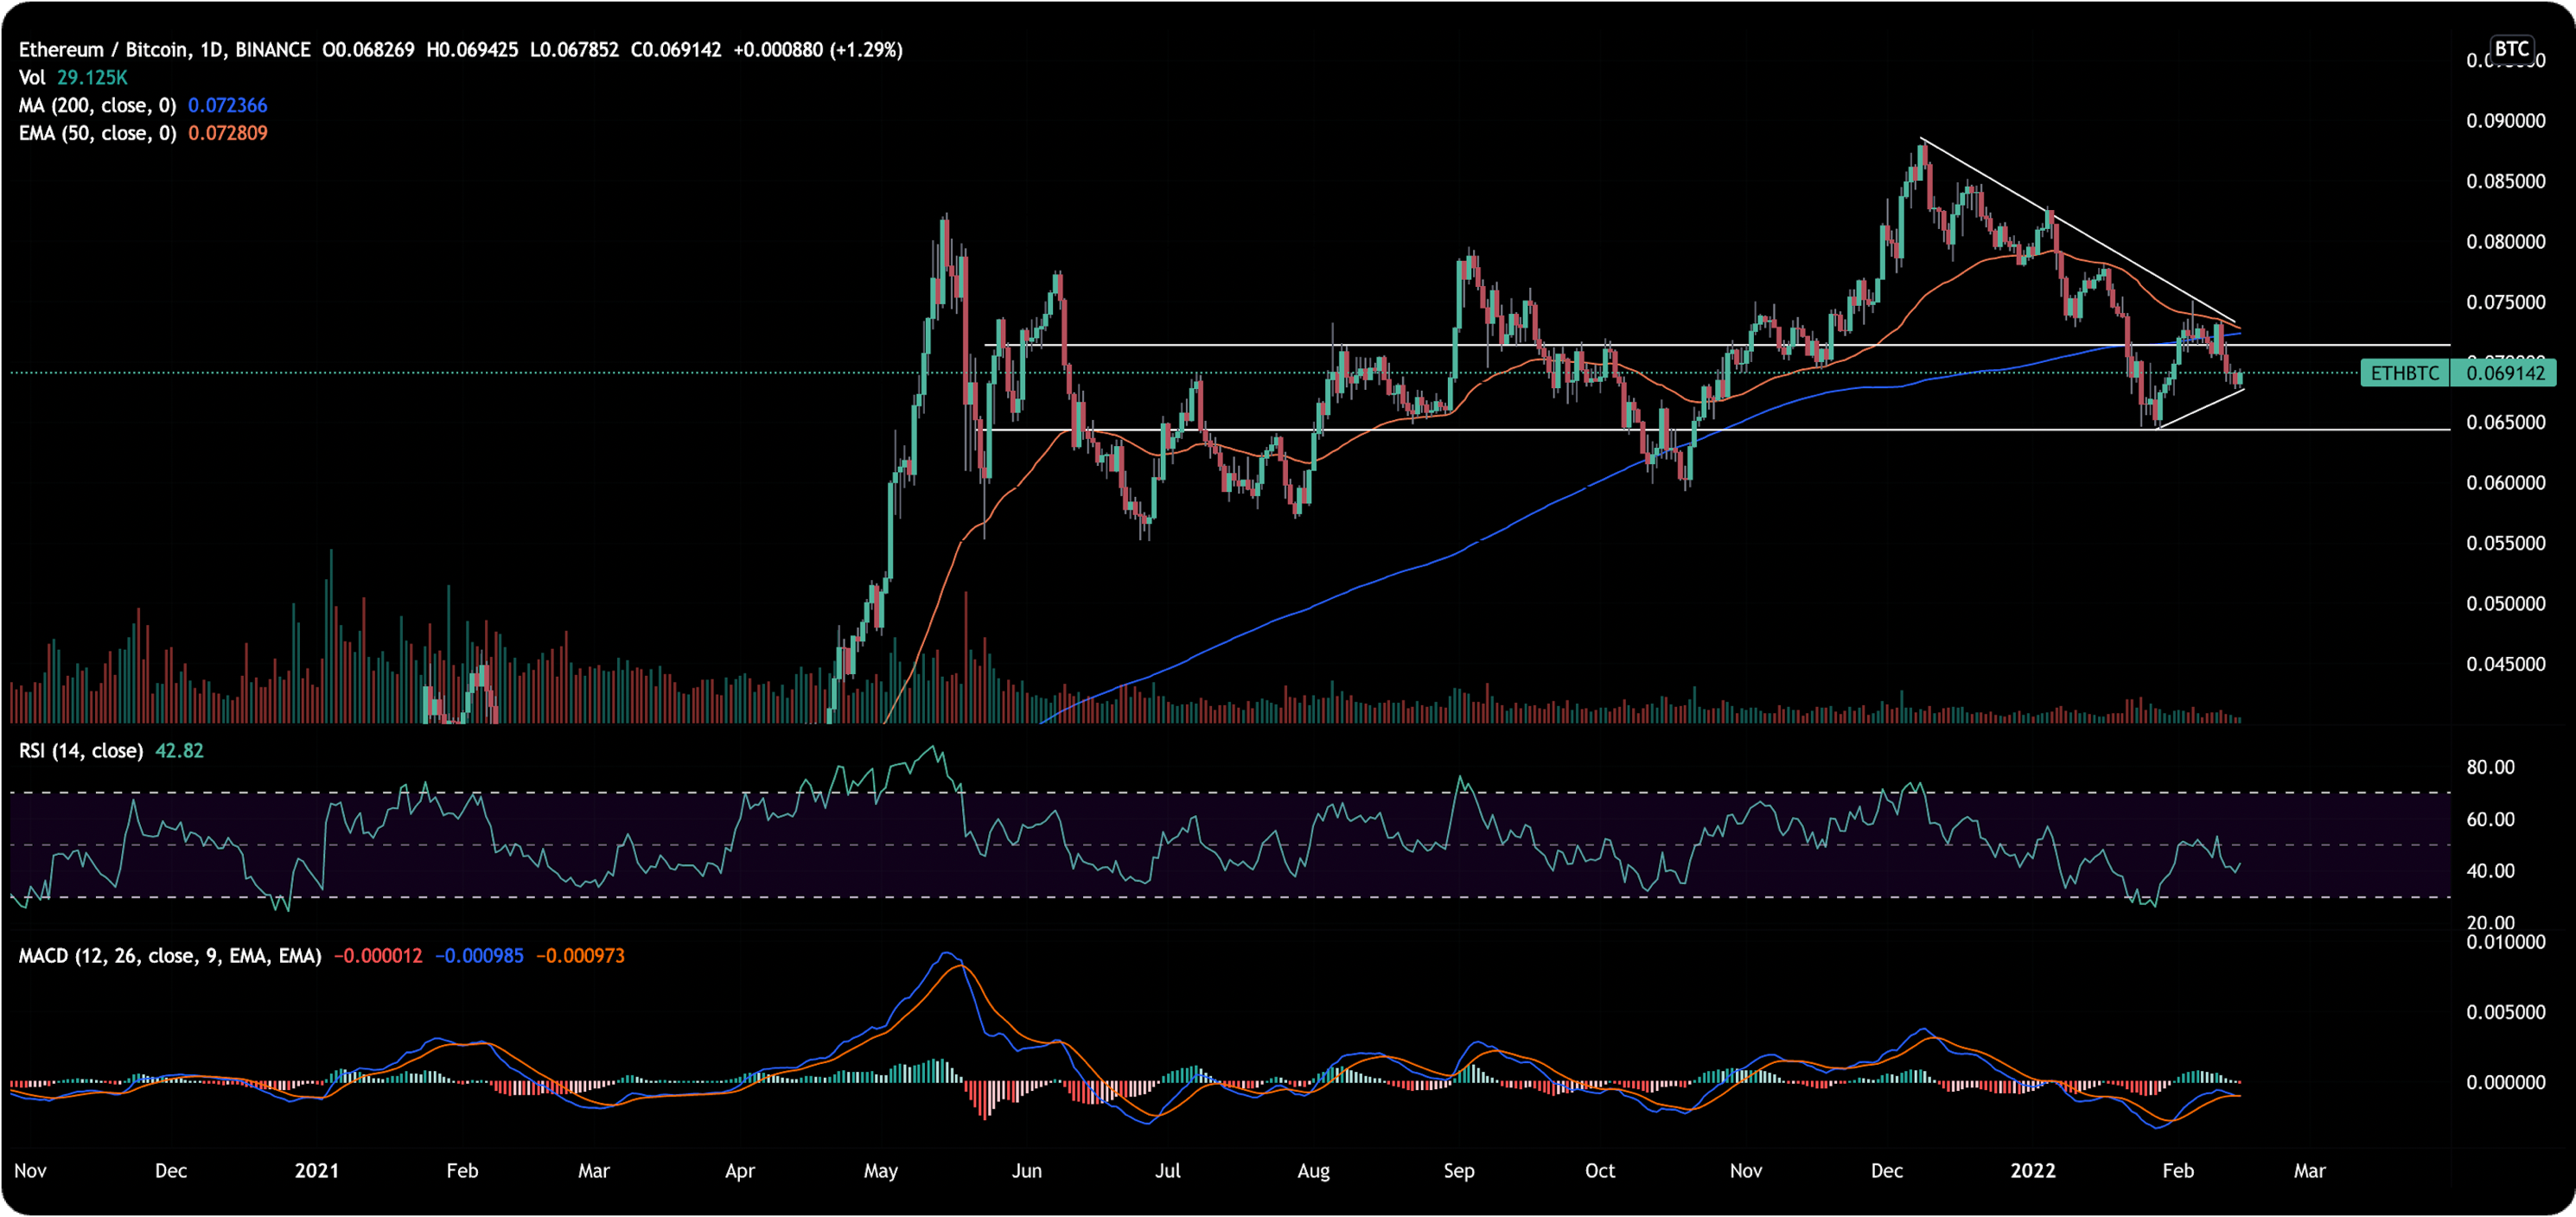
Price action; Choppy price action after CPI print. BTC/USD finding support at the $42k and looks to stay above the 50d EMA. ETH/BTC making lower highs and higher lows appearing with the pair finding support at ~0.67.
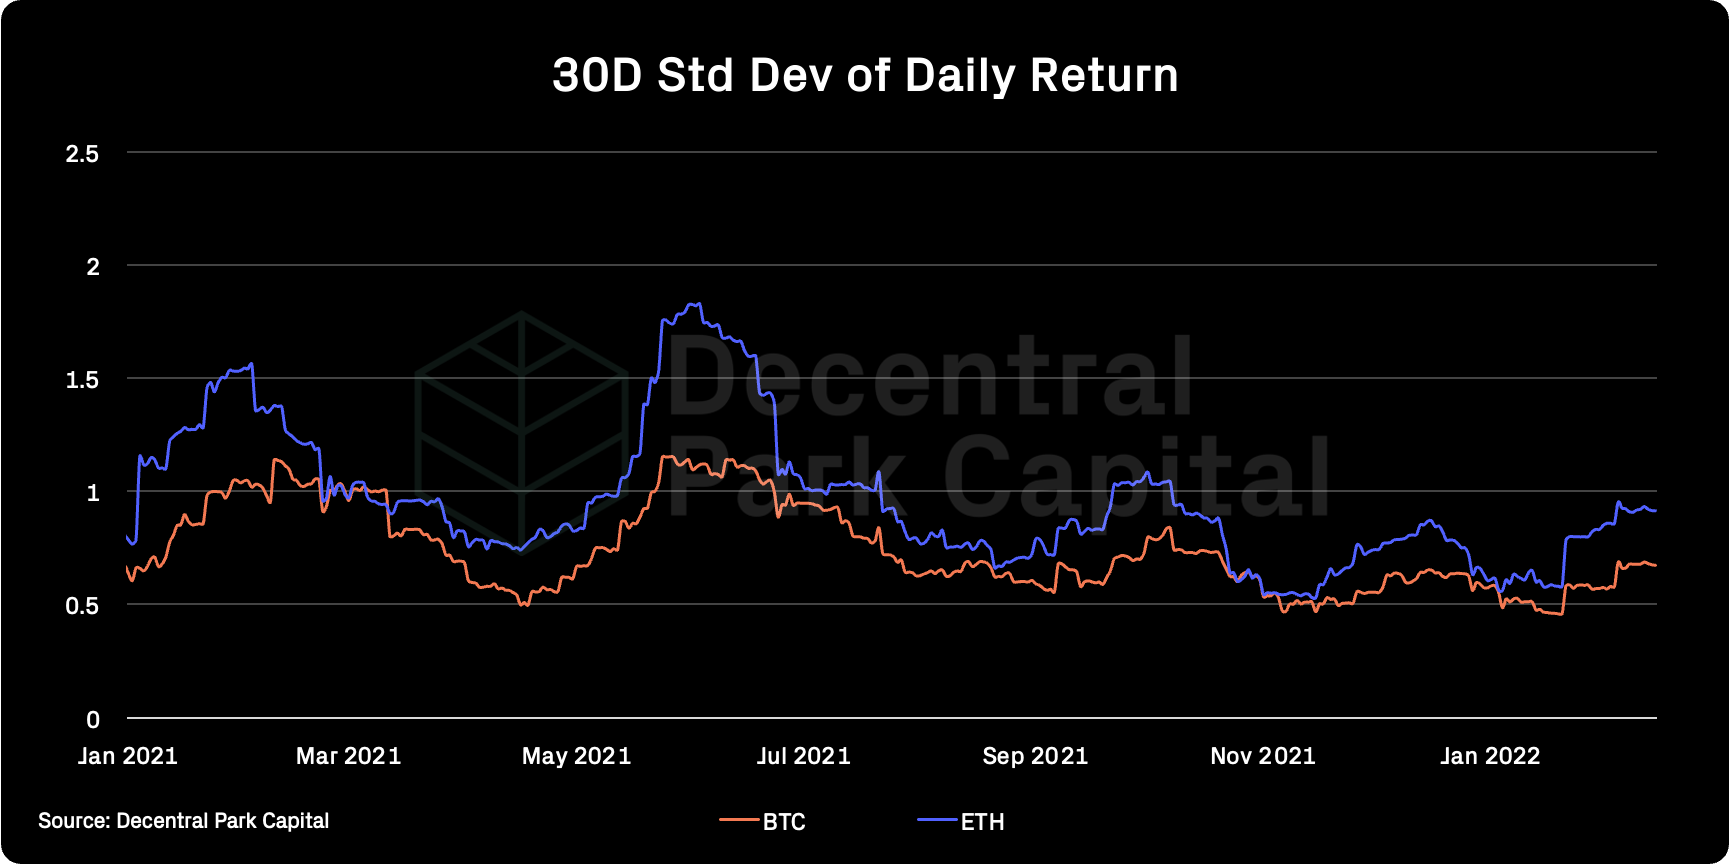
Volatility (BTC & ETH); BTC 30D vol has kept flat while ETH has spiked upwards in recent days. Implied vol for BTC and ETH 66% and 76% respectively.
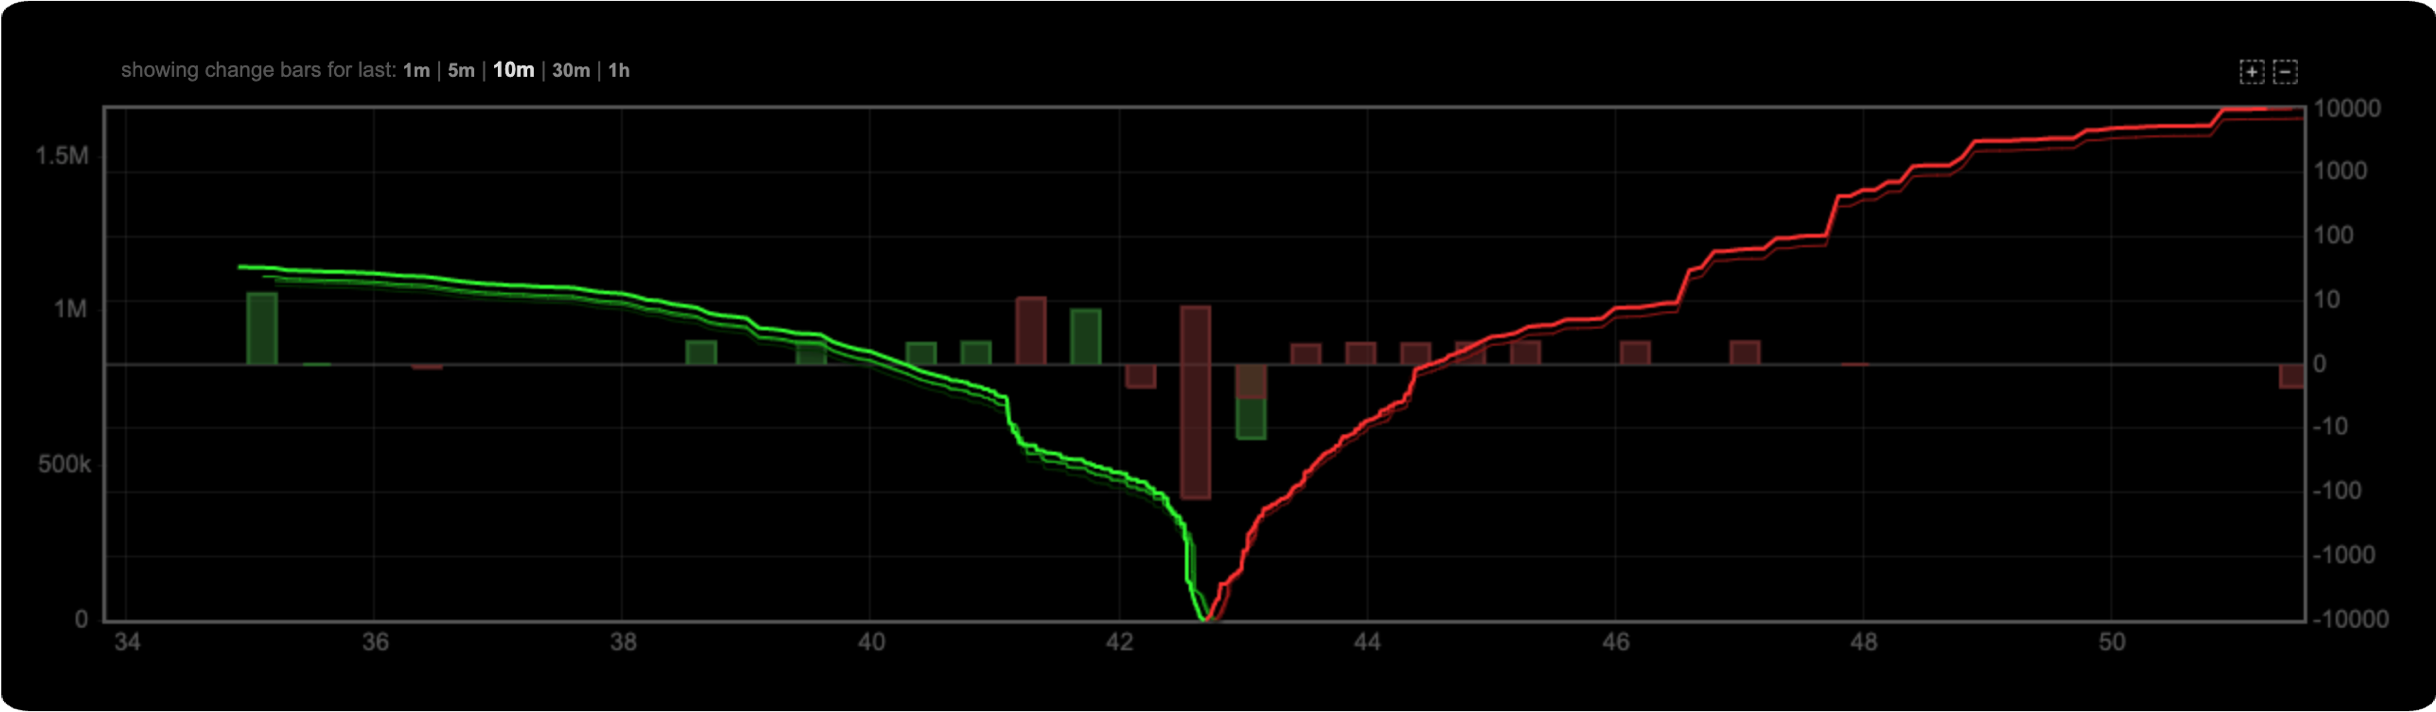
Combined order books; Order books heavier on the ask side. Heavier resistance up to $44.3k (Source: Bitcoinity).
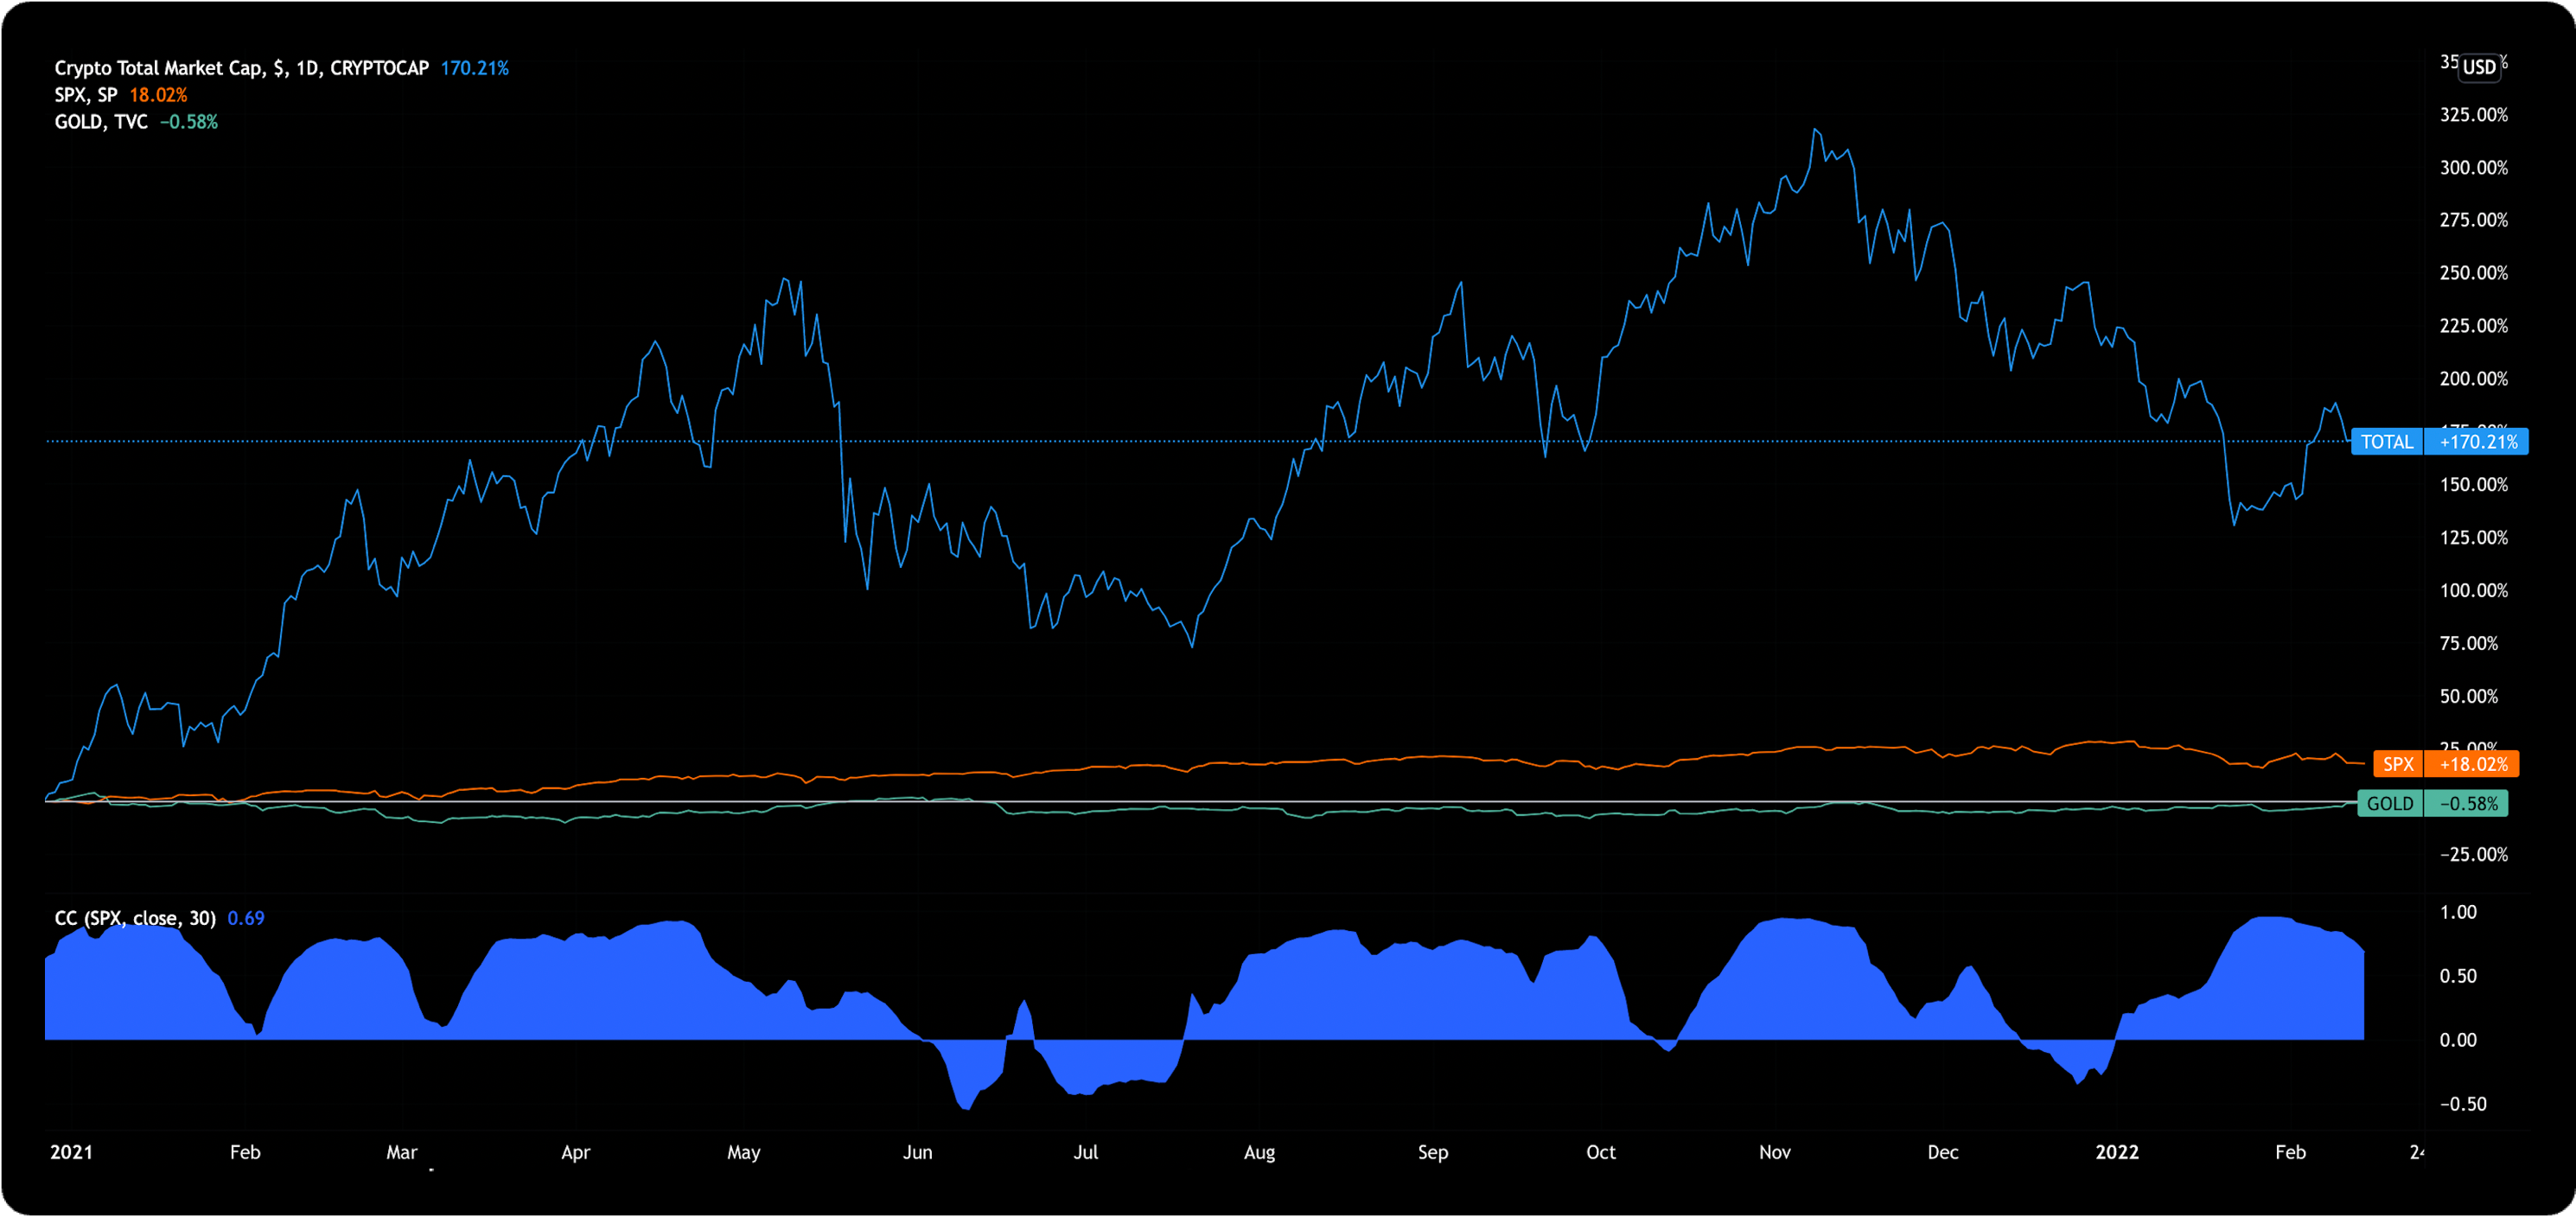
Crypto vs. SPX; Correlations between crypto and equities falling slightly but relationship remains positive and is more likely to remain positive at least over the coming months given the macro events on the global stage.
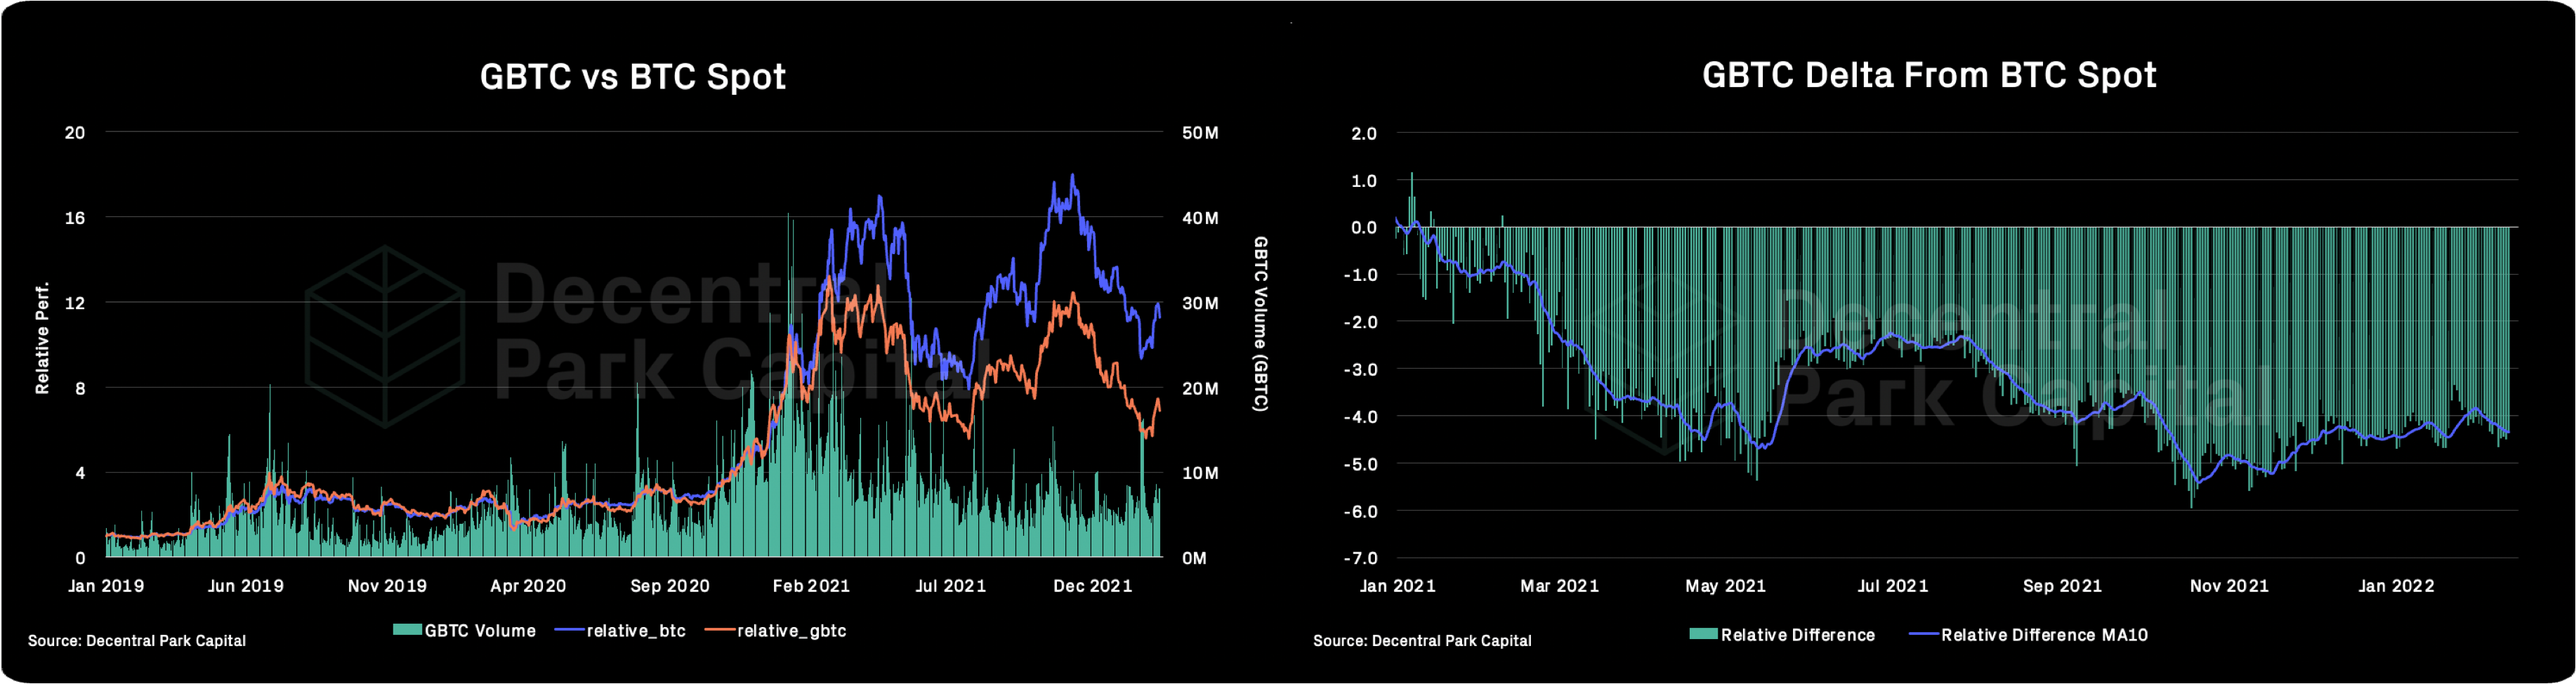
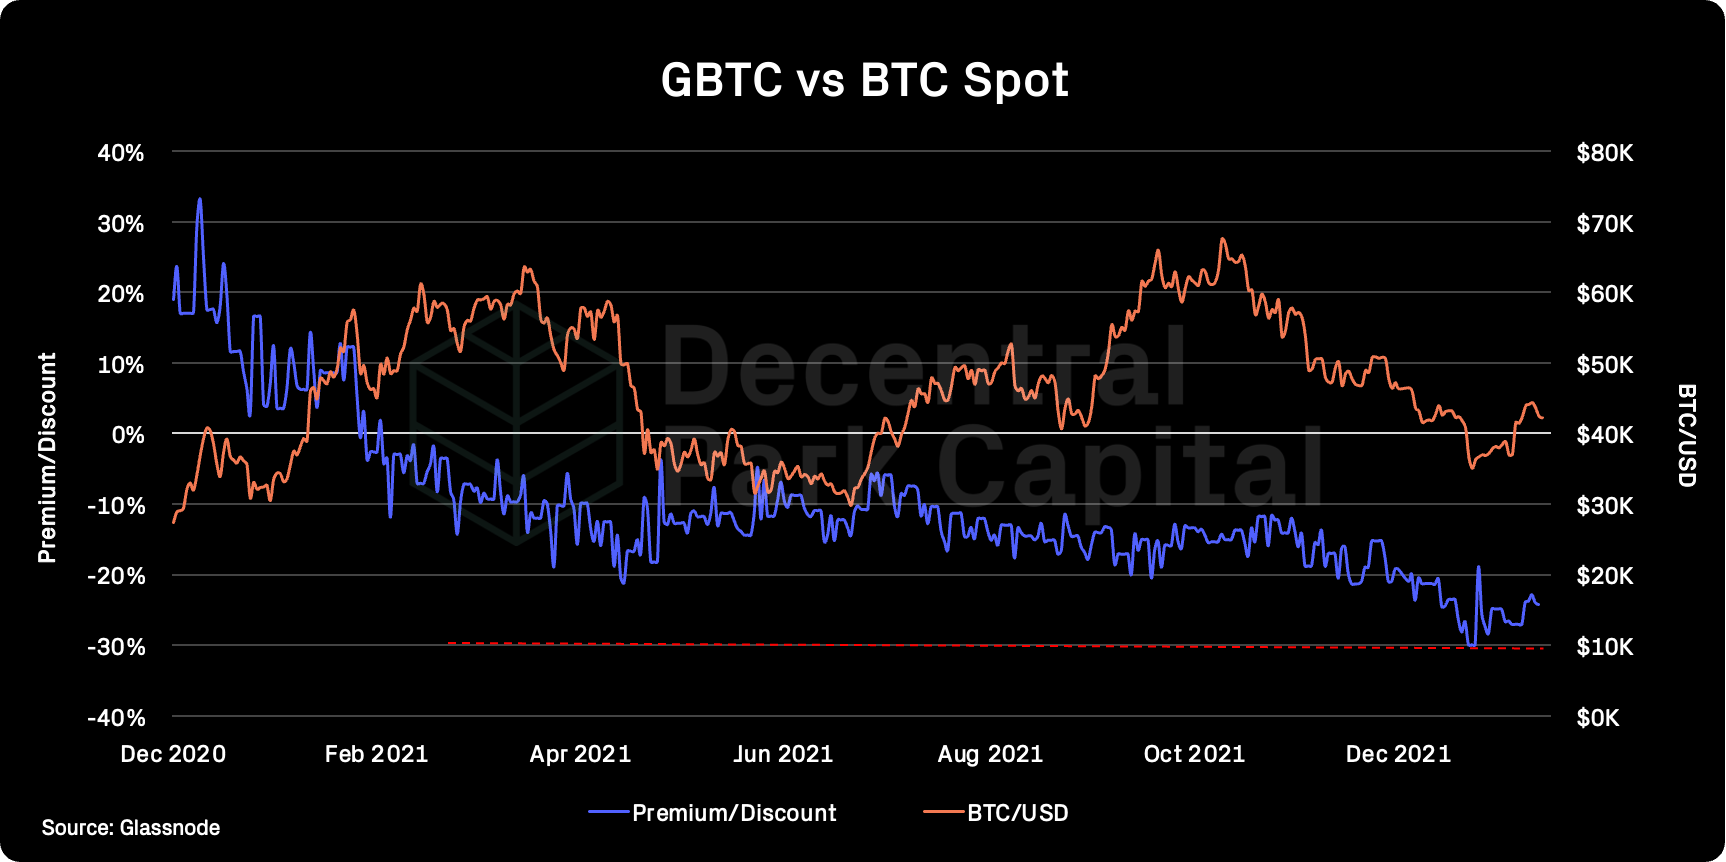
GBTC premium; No notable decrease/increase in discount for GBTC which now stands at 24%. 30D volumes have increased 30% YTD and could indicate renewed interest in GBTC at current discount and recent spot rally.
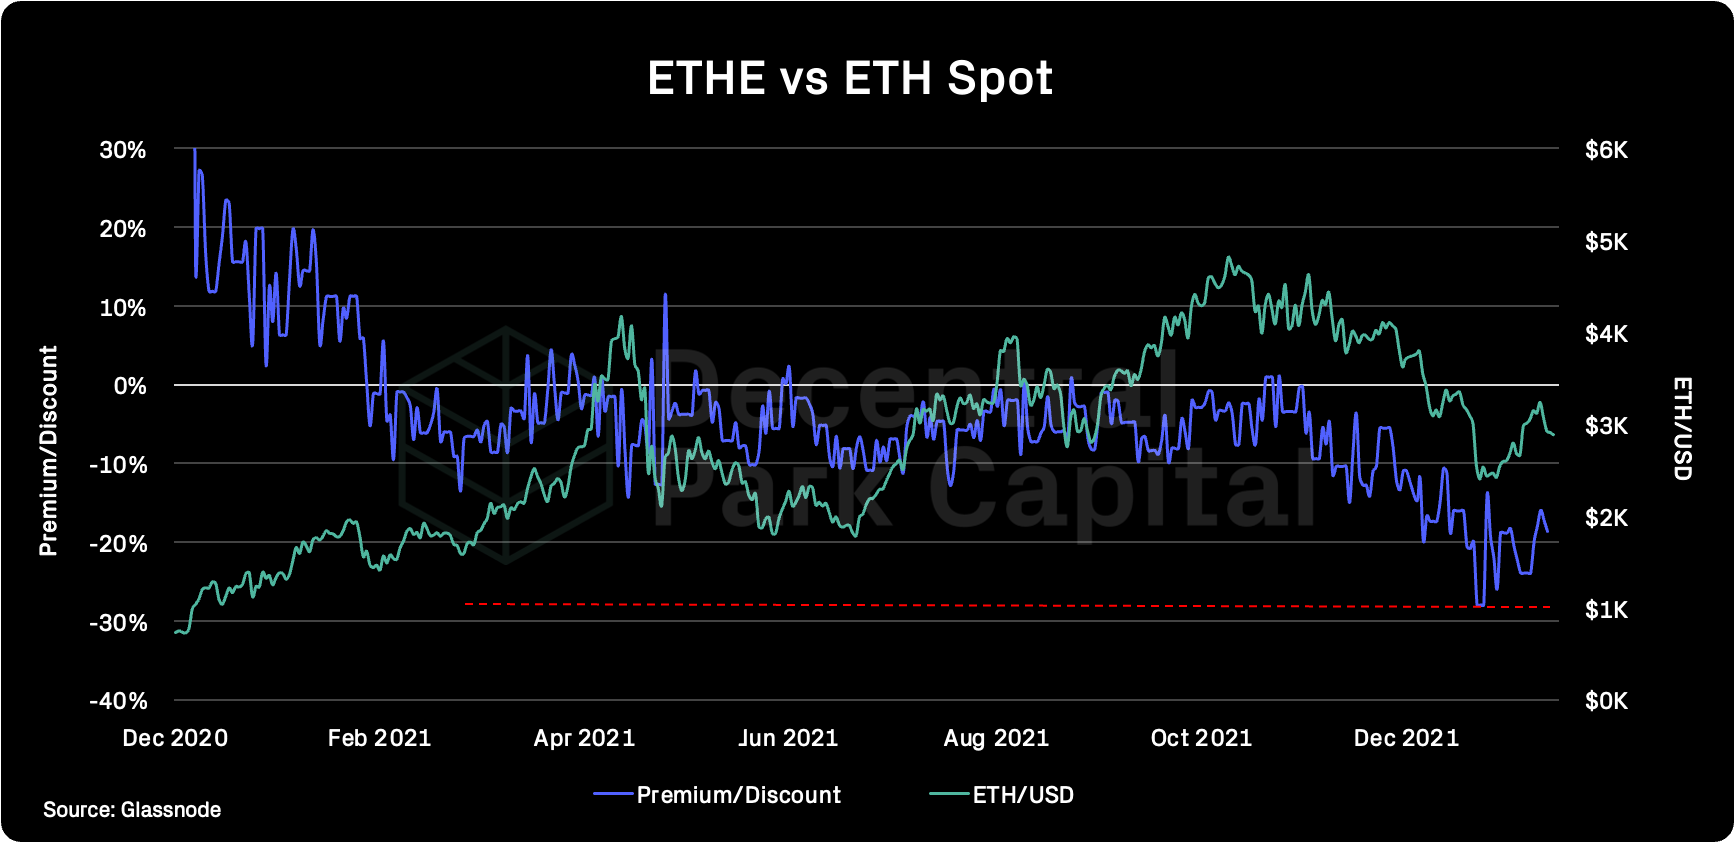
ETHE premium; Similar dynamic with ETHE with the discount at 18.67%. Not clear if discount will break out above its descending channel since October 2021. 30D MA volumes kept flat (divergence with GBTC volumes).
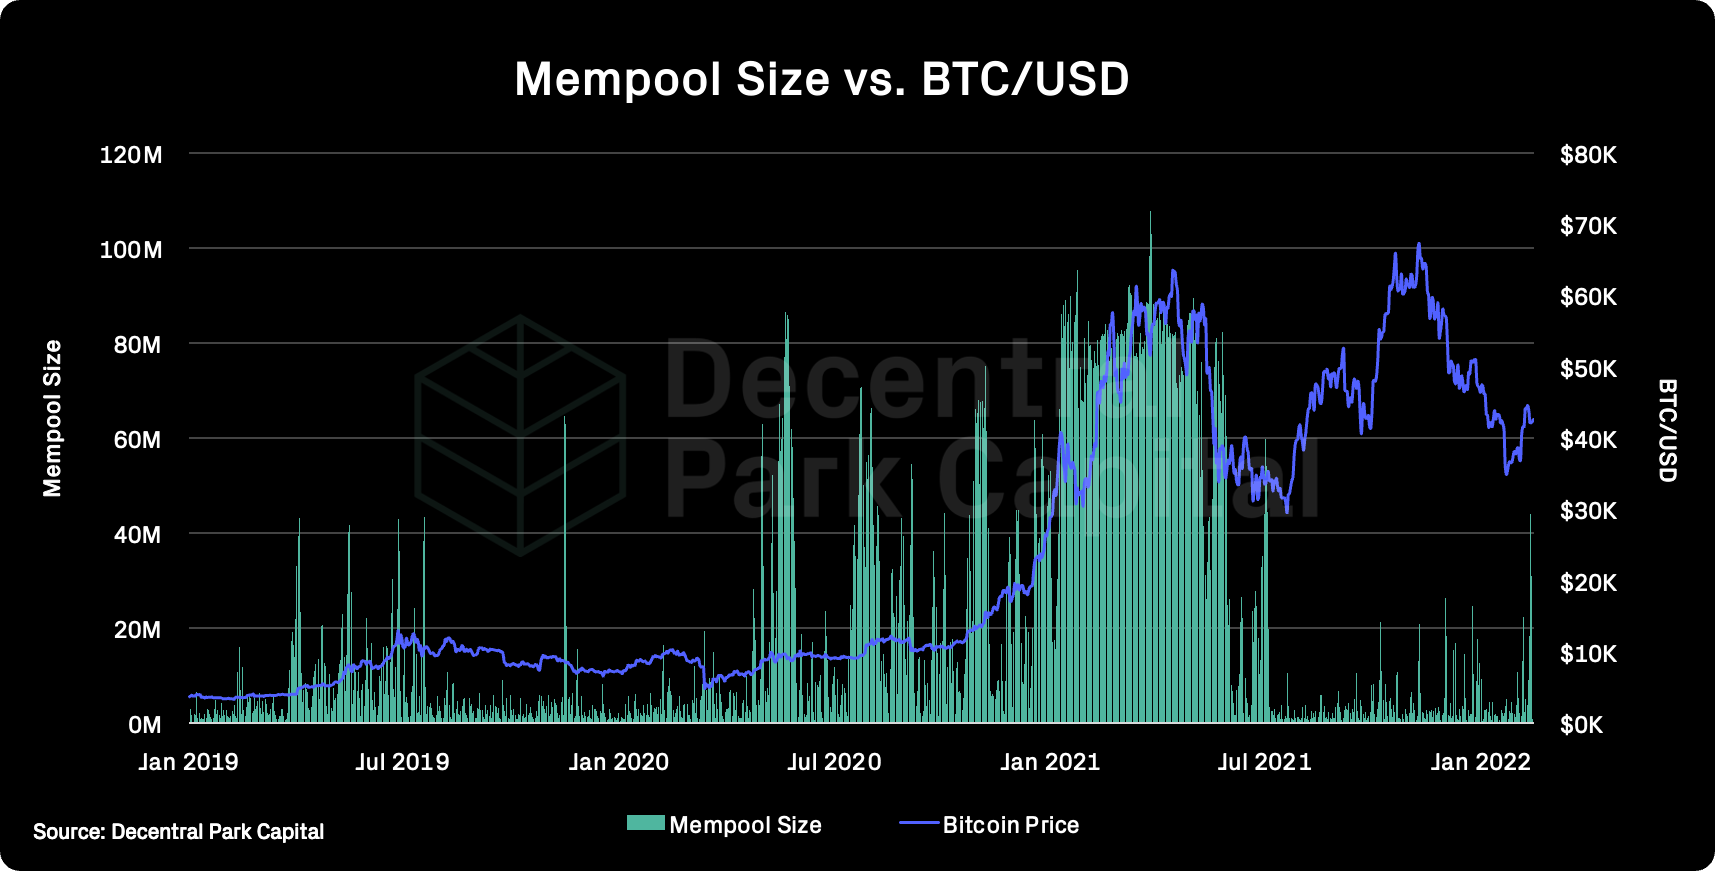
Bitcoin Mempool activity (Size in MB); The mempool size for the Bitcoin network has picked up in recent days as BTC rallied to $45k. Note this marks more congestion on-chain than in July-November 2021. Unclear whether this is related to the Bitfinex news.
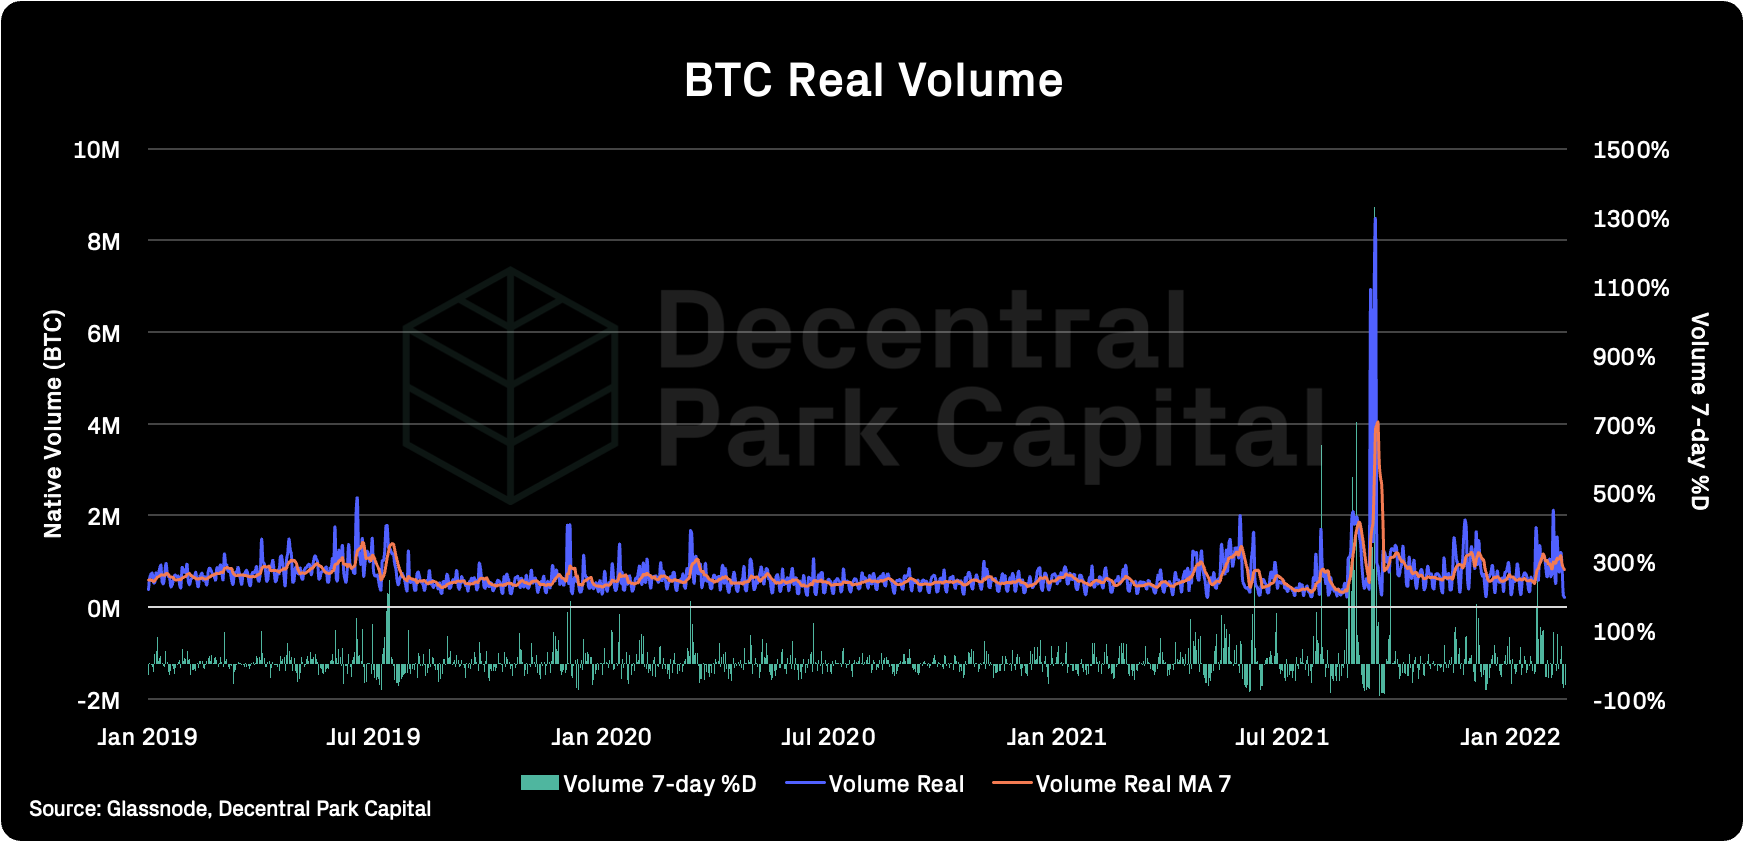

On-chain real (BTC) & off-chain volume; BTC on-chain volume has fallen 22% over the past week. BTC spot volumes has increased 19% and 2% for ETH over the past week (7d MA).
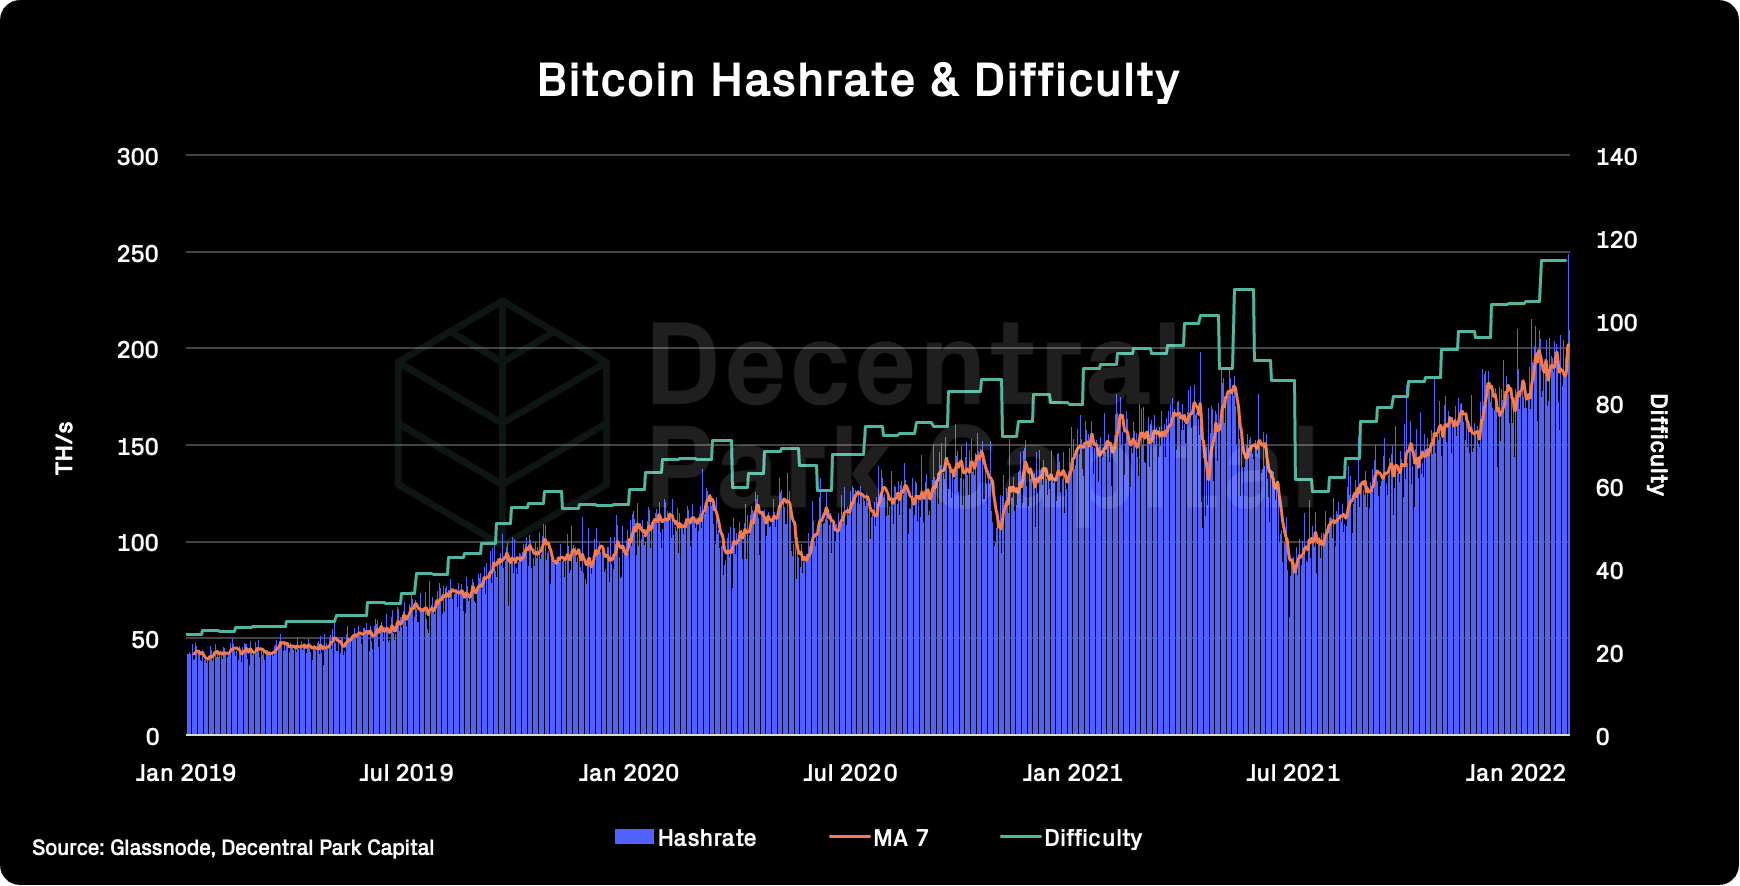
Hashrate & Difficulty; Bitcoin hashrate has hit new all-time-highs reaching 248.1m (TH/s).
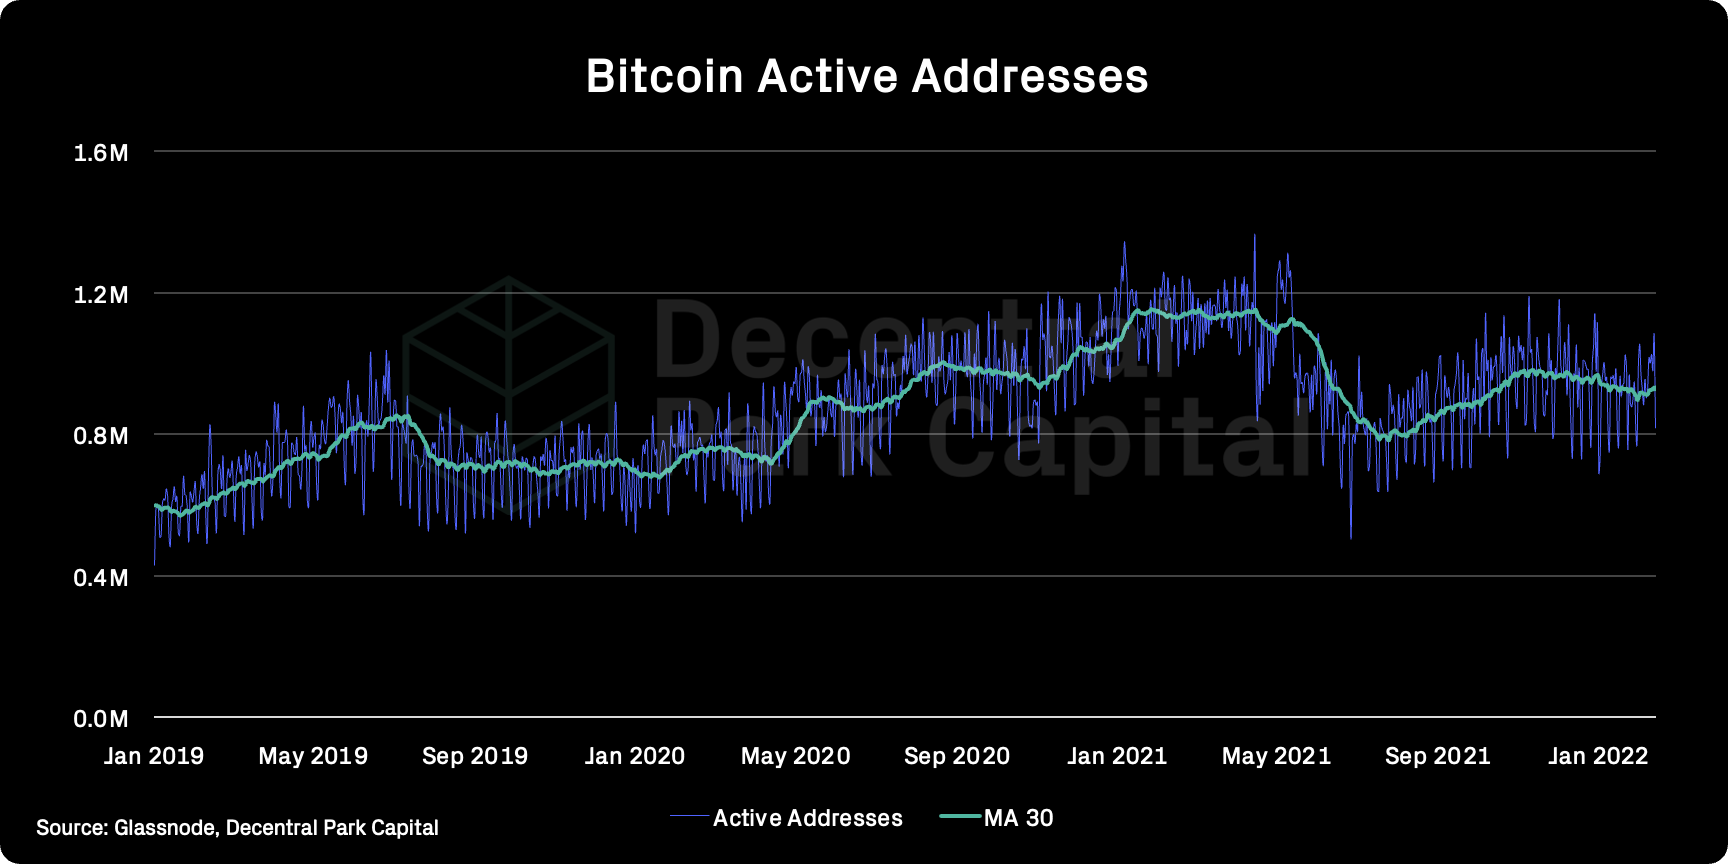
Active addresses (BTC); Active addresses (30d MA) has increased 1.6% over the past week and is recovering slightly from annual lows.
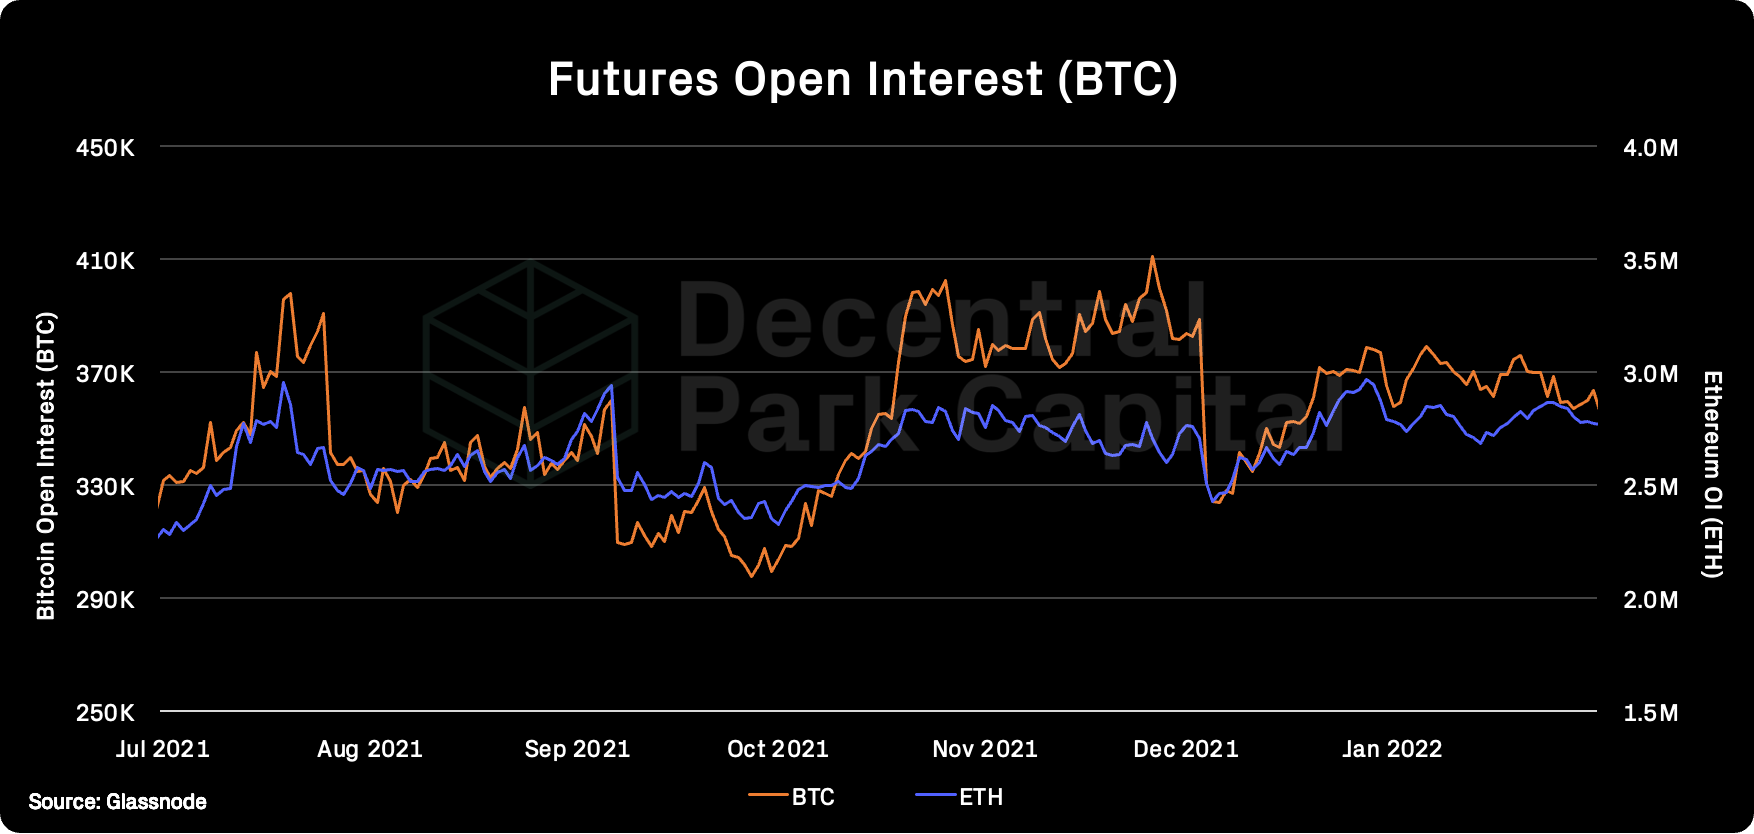
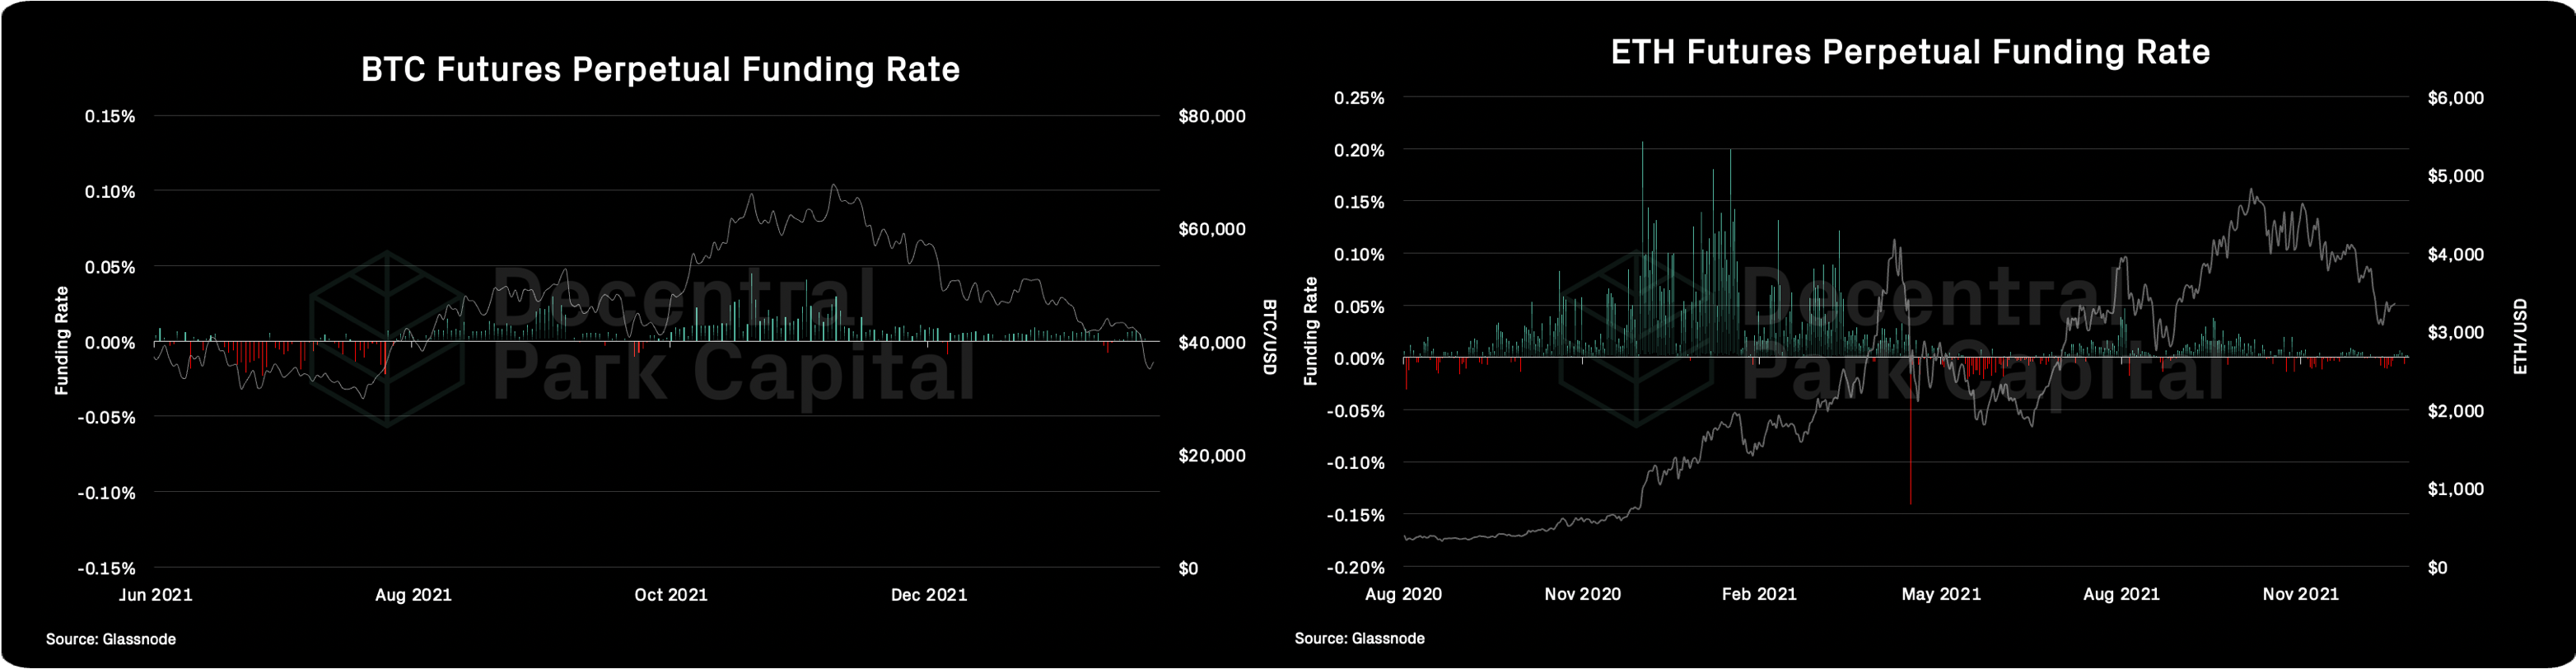
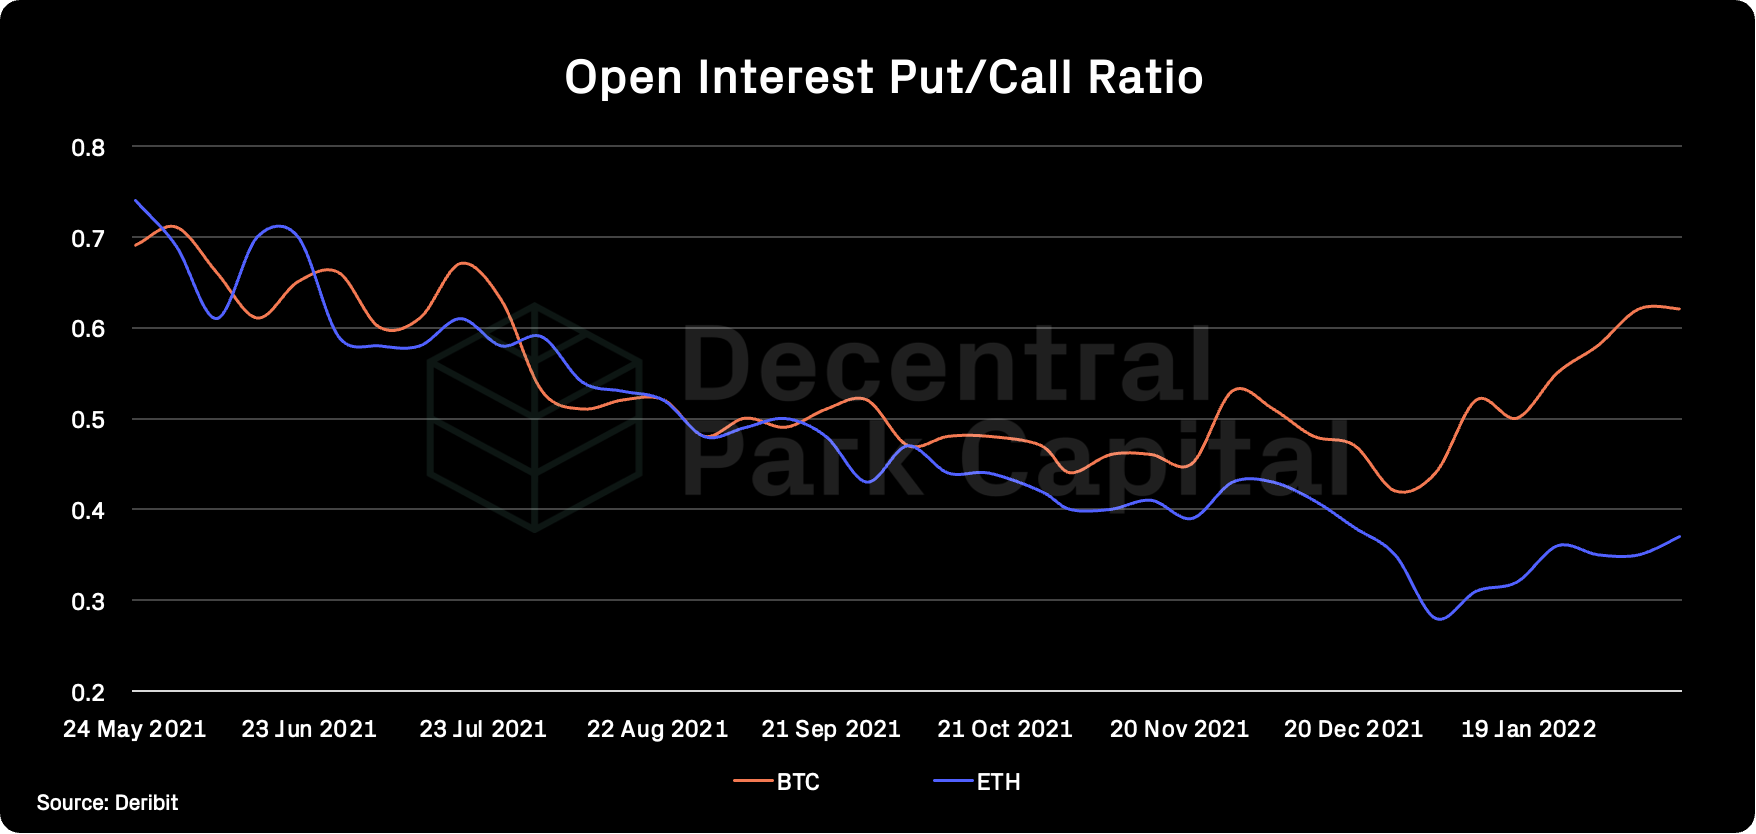
Trader positioning; Traders adding to puts to protect downside and indicates limited bullish conviction from traders. OI for BTC and ETH denominated in the native cryptoasset are falling over the past week. Funding rates slightly positive and overall higher on the BTC side than ETH (0.003%).
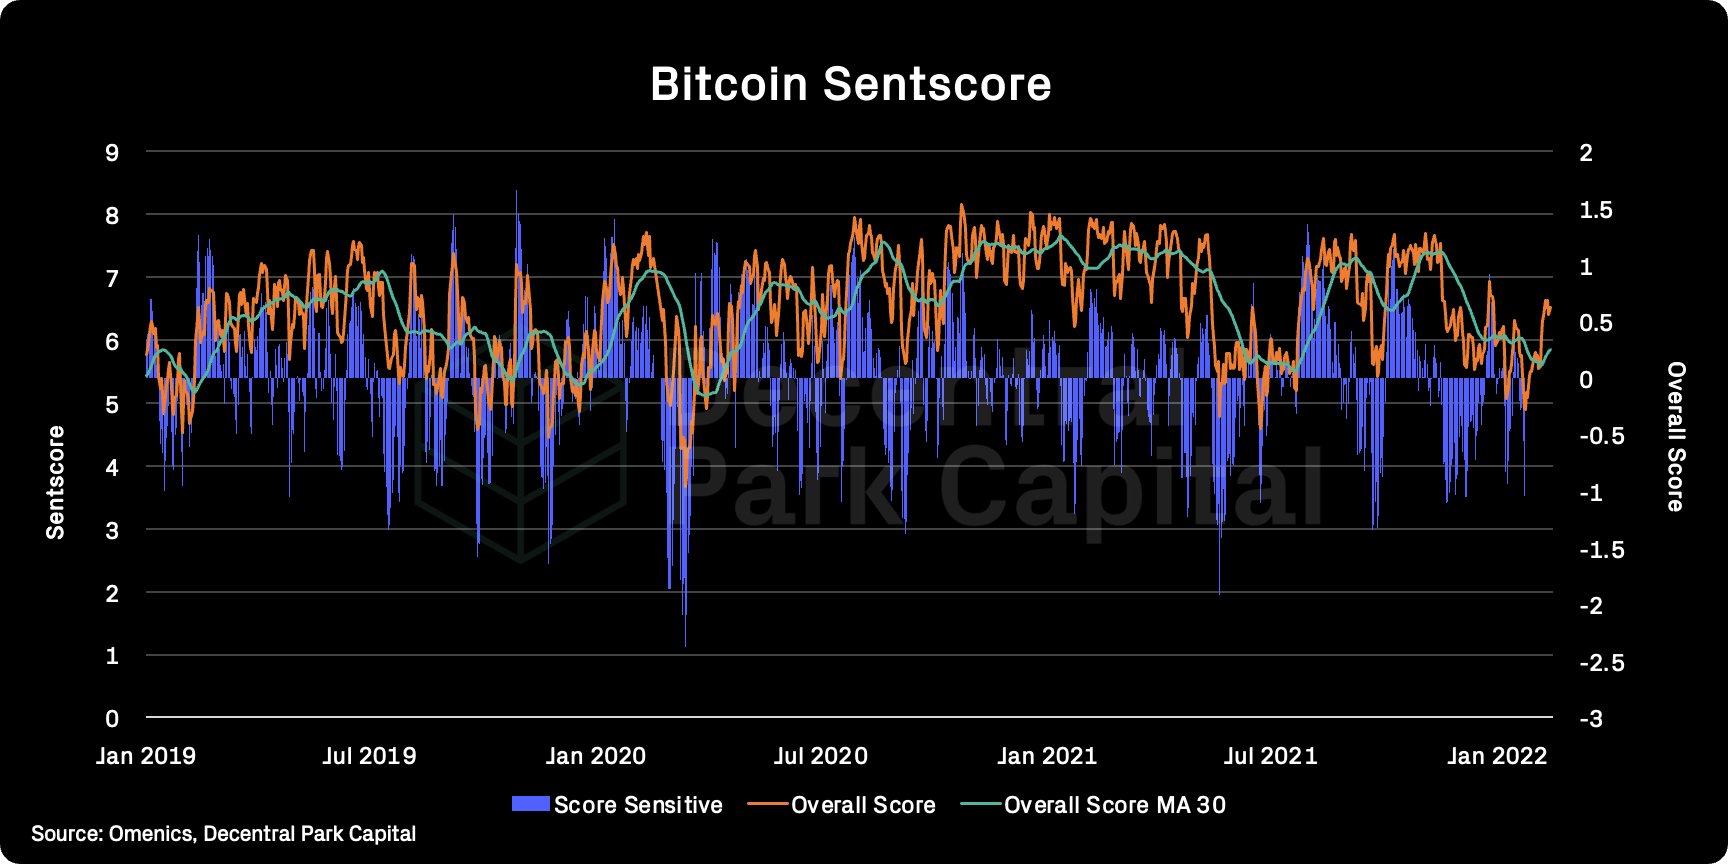
Omenics Sentscore (BTC); Sentiment score around BTC has been buoyed by recent spot action.

Exchange inflow/outflow (BTC, ETH); BTC exchange flows continue to be net negative (~$1.4b). ETH net outflows from exchanges much smaller at $140m.
📚 On Frax Finance [Decentral Park Capital]
📚 DAO Organizational Structure [@singularityhack]
📚 Fund Flows [@cryptounfolded]
📚 This Week In NFTs [@CryptoGucci]
📚 veYFI [@cryptouf]
🎙️ NFTs, Markets, and What Happened [The Breakdown]
🎙️ Gitcoin - Building And Funding Web3 [Epicenter]
🎙️ Remonetizing The Internet Using Lightning [On The Brink]
🎙️ Crypto In Washington [Bankless]
🎙️ Monetary Tightening & End Of Risk-On Trade [Hidden Forces]
The information above does not constitute an offer to sell digital assets or a solicitation of an offer to buy digital assets. None of the information here is a recommendation to invest in any securities.